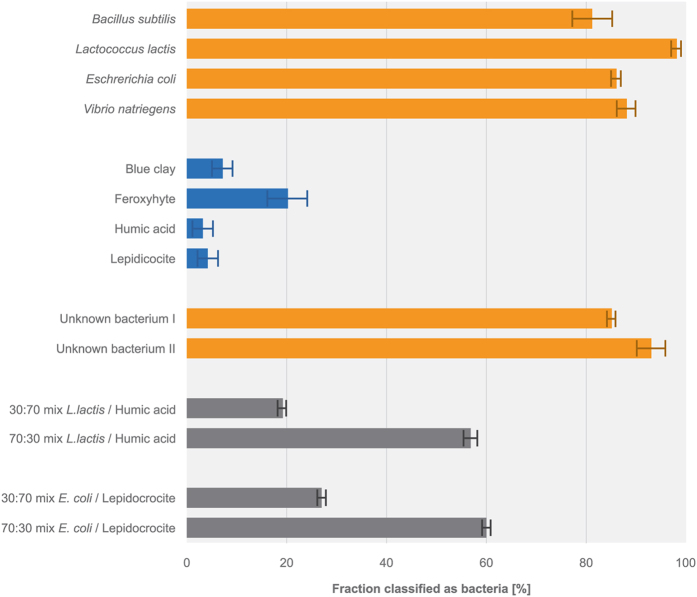
Figure 2. Ability of the sensor to distinguish between bacteria and abiotic particles in suspensions shown as the fraction classified as bacteria.
The suspension included model particles in pure suspensions (orange: bacteria, blue: abiotic particles) and mixtures of bacteria and abiotic particles (grey). Mixed suspensions would ideally be reported as 30 and 70% bacteria if they were classified 100% correctly. Error bars represent standard deviations.

