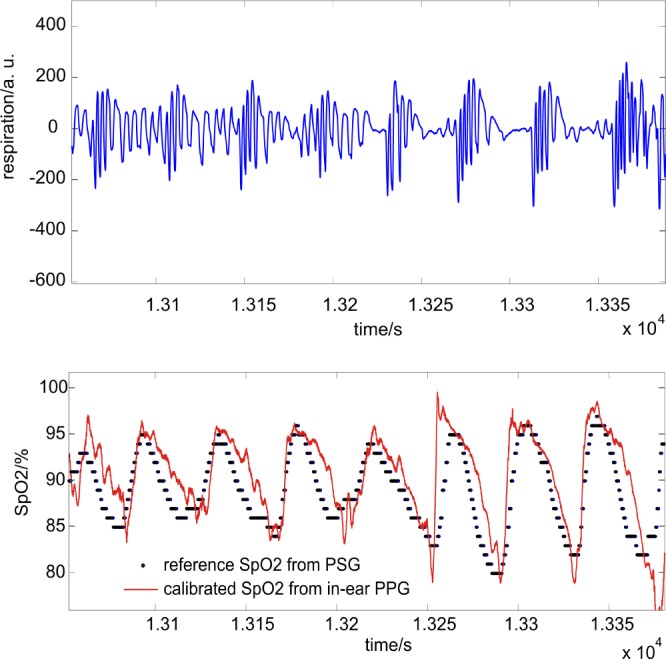
Fig. 6.

Upper panel: respiration flow (breathing air) obtained by PSG; clearly shown are three successive breathing stops of up to 30 seconds each. Lower panel: comparison of SpO2 derived from the in-ear PPG sensor (red solid line) and polysomnography (for the same time segment, black dots). The drops in oxygen saturation are clearly identified by both sensors.
