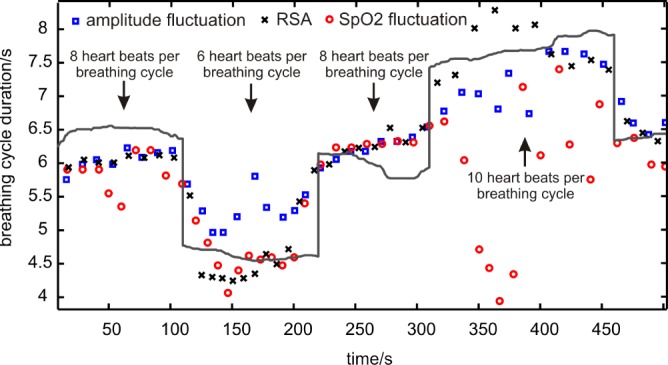
Fig. 7.

Breathing cycle durations were calculated by three different methods and compared with the reference (grey solid line): variance in PPG amplitude (blue squares), respiratory sinus arrhythmia (black crosses), variation in Spo2 (blue circles). The respiration-rate-to-heart-rate-quotient was fixed to 1:8, 1:6, 1:8, 1:10, 1:8.
