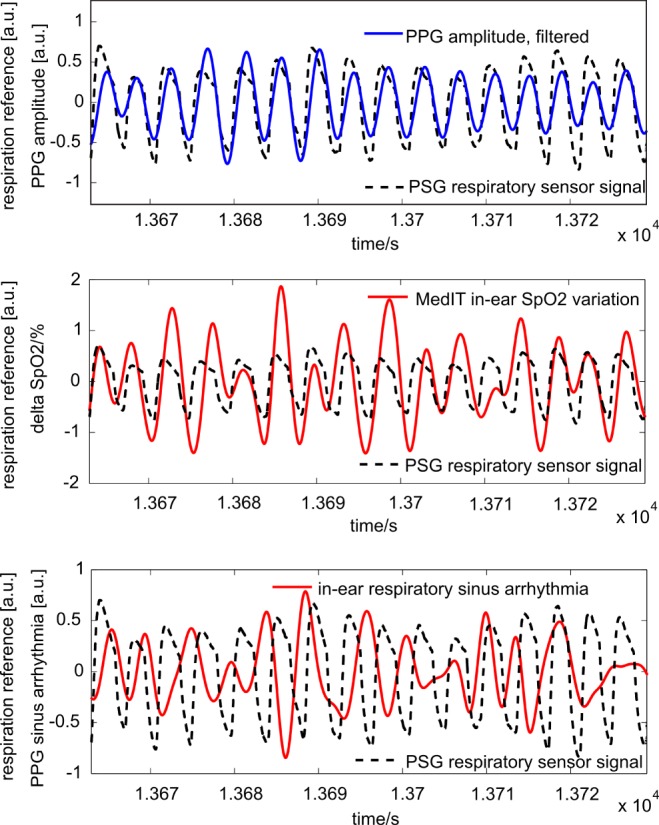
Fig. 8.

Respiration was calculated by three different methods and compared with respiratory reference sensor signal derived from a PSG nasal sensor (dashed line): segmentation by PPG amplitude (upper panel, solid line), segmentation by  variation (middle panel, solid line) and respiratory sinus arrhythmia (lower panel, solid line). All amplitudes are normalized to enable better comparability. Only
  variation is presented in absolute values (%).
