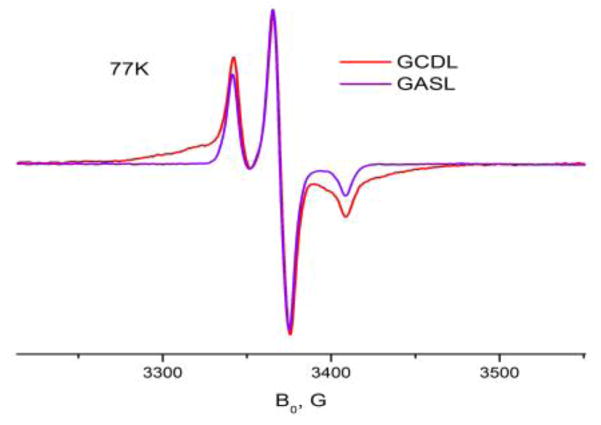
Figure 1.
ESR spectra of 0.6% GCDL (red line) and GASL (blue line) in DLPC at 77K. The broad feature of the GCDL spectrum is due to two spin labels attached to the same GC molecule in close proximity to each other. Analysis according to (Rabenstein and Shin, 1995) gives an average interspin distance of ~ 9Å with a relatively broad distance distribution.

