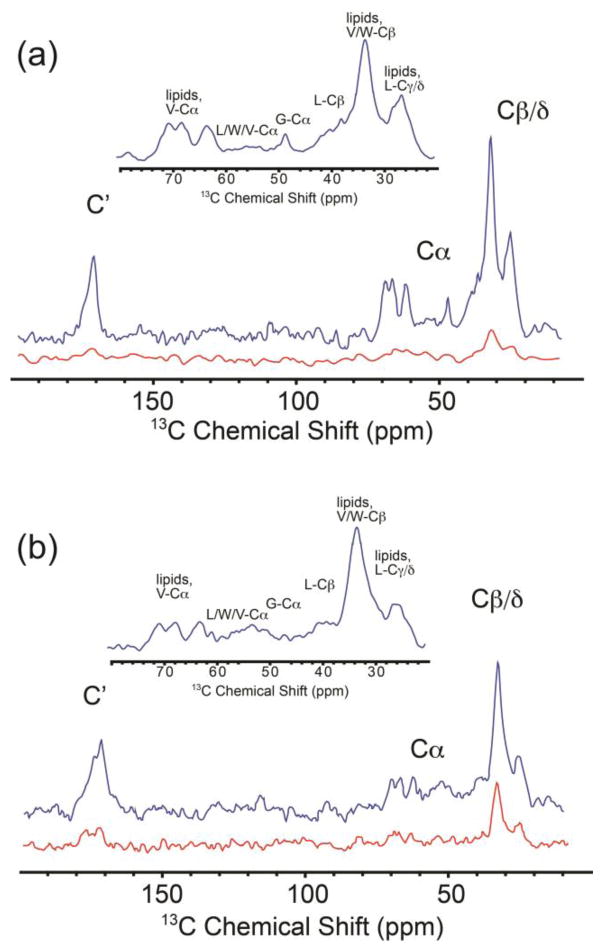
FIGURE 3.
1H-13C Cross Polarization 1D 13C NMR spectra of GALN and GCDL. Blue traces are DNP-enhanced spectra upon microwave irradiation while red traces are the same experiment without microwave irradiation. Spectra for 2H lipid vesicle bound GALN (a) and GCDL (b) reveal protein peaks, despite the fact that the protein has natural abundance 13C. Aliphatic regions are highlighted in the insert. All spectra were acquired at 400 MHz 1H Larmor frequency with a sample temperature of 105 K (uncorrected for microwave heating and MAS. True sample temperature is estimated to be 115 K.). Spectra were processed with 30 Hz of Gaussian line broadening. Observed signal enhancements for GALN (a) was 6, and 3.5 in the case of GCDL. To obtain comparable S/N in spectra acquired without DNP enhancement would require ~25 hours of signal averaging.

