Figure 3.
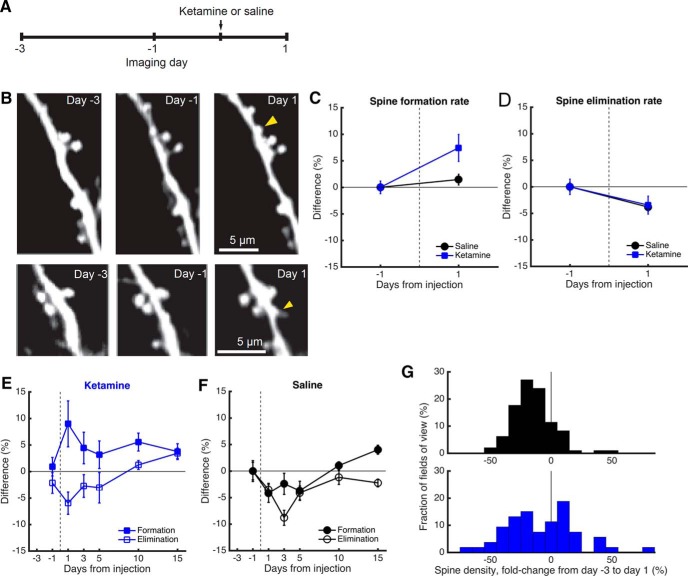
Higher spine density is due to an elevated rate of spine formation. A, Time line of the experiment. Ketamine was administered at a dose of 10 mg/kg through intraperitoneal injection. B, Images of two different apical dendritic tuft branches at days −3, −1, and 1 from ketamine administration in a Thy1-GFP-M mouse. Yellow arrowhead, new spine. C, Change in spine formation rate, expressed as the difference from the value measured between days −3 and −1 (i.e., preinjection sessions). The mouse was injected with either ketamine (blue square) or saline (black circle). Values are reported as the mean ± SEM. N = 58 and 97 fields of view across three sessions for ketamine- and saline-injected mice. D, Same as C for spine elimination rate. E, Change in spine turnover dynamics across days for mice injected with ketamine. Solid square, spine formation rate. Open square, spine elimination rate. Values are reported as the mean ± SEM. F, Same as E for controls with saline injection. N = 28 and 25 fields of view across seven sessions for ketamine- and saline-injected mice. G, A histogram of the change in dendritic spine density, expressed as the fold change from day −3 to day 1 from injection. Top, saline. Bottom, ketamine. N = 58 and 97 fields of view for ketamine- and saline-injected mice.

