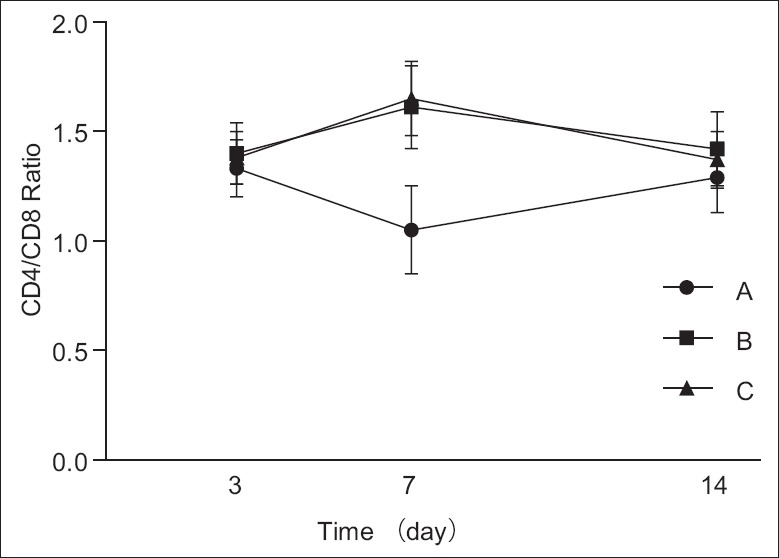
Figure 4.

Ratio of three groups was almost the same on the 3rd and 14th day. As time passed, Group A showed a trend of decline, then ascended later. On the 7th day, the ratio declined to bottom. Group B and C increased first and then decreased. The ratio climbed to the climax on the 7th day. The difference was statistically significant on the 7th day (P < 0.05). Group A, intrathymic injection of 100 μl myelin basic protein (1 mg/ml); Group B: Intrathymic injection of 100 μl phosphate buffered saline (PBS); Group C: Sham operation group.
