Figure 3.
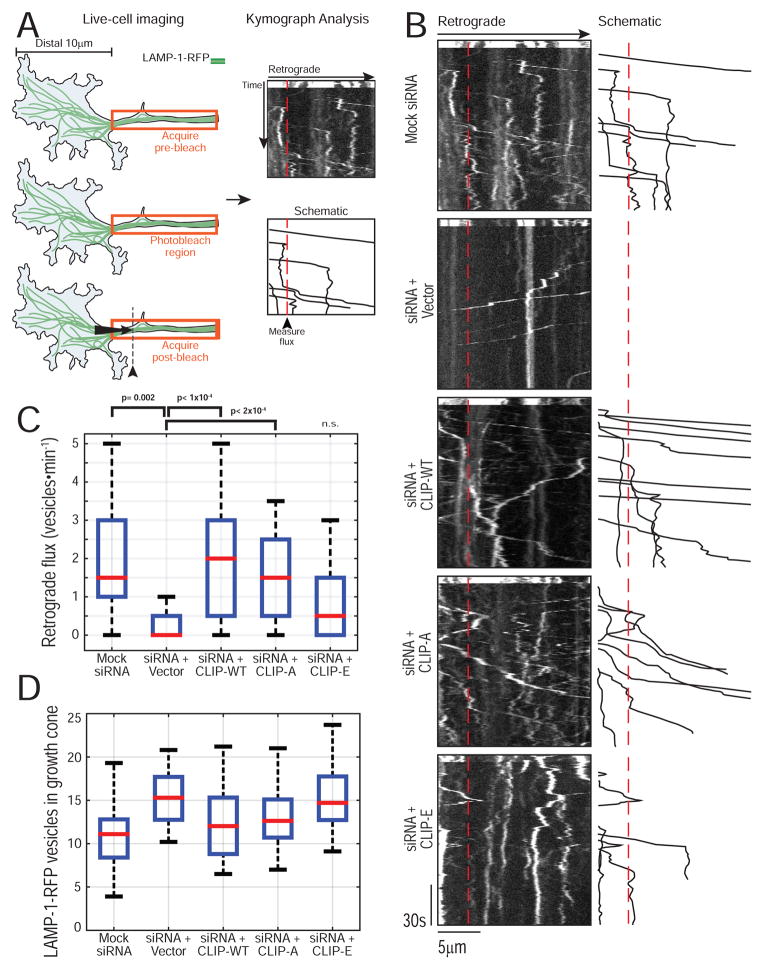
CLIP-170 phosphorylation state modulates retrograde transport initiation in neurons. (A) Schematic of live-cell assay for retrograde transport initiation in neurons. (B) Representative kymographs for each condition with a schematic tracing of the analyzed vesicles to the right. The dashed red line indicates 3.5μm from the distal end of the bleaching ROI and is the site for flux analysis. (C) Quantification of retrograde flux for all conditions. CLIP-170 knockdown reduces the efficiency of retrograde flux and this is rescued by CLIP-WT or CLIP-A, but CLIP-E shows incomplete rescue (n= 18–36 neurons total, N > 3 experiments; KW ANOVA with Tukey post-tests). A complete list of the pairwise post-tests is shown in Table S1. (D) Quantification of the number of LAMP-1-RFP vesicles in the growth cone at the start of the movie shows a comparable distribution of vesicles indicating that the reduced retrograde flux in the siRNA or siRNA + CLIP-E is not due to a reduced distal vesicle pool.

