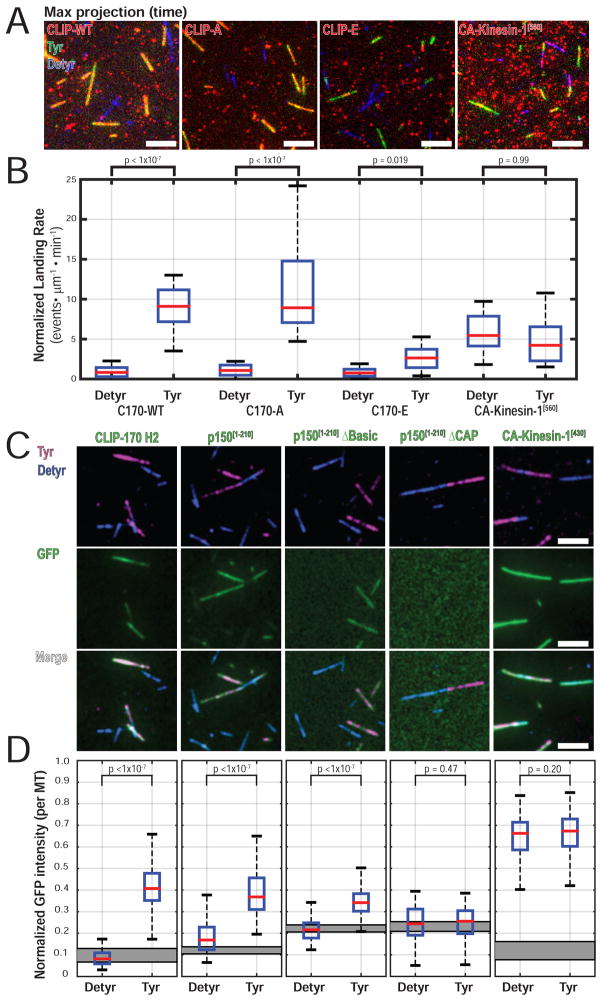
Figure 6.
CLIP-170 phosphorylation regulates recruitment to Tyr-microtubules. (A) Image of max intensity projection over time shows selective localization of CLIP-WT and CLIP-A to Tyr microtubules. CLIP-E shows reduced localization to Tyr microtubules. (B) Quantification of landing rate on Tyr- or Detyr- microtubules shows a significantly increased landing rate of CLIP-WT and CLIP-A on Tyr-microtubules. CLIP-E retains a significant preference for Tyr-microtubules, but landing is significantly reduced compared to CLIP-WT or CLIP-A (a table of all pairwise post-tests is found in Table S2). Single molecule landing rates for CA-Kinesin-1[560] in cell extracts show no differences between Tyr-/ Detyr-microtubules (n > 24 movies per condition, each movie with > 500 events; N = 3 independent cell lysate preparations; KW ANOVA with Tukey post-tests). The estimated final concentration of TMR-labeled HT-CLIP in this assay was ~0.5nM for HT-CLIP constructs or 2.5nM for CA-Kinesin-1[560]. (C) Image panel for ensemble recruitment assay using 100nM purified proteins. Faint GFP-p150[1-210] signal is present on Detyr microtubules and is likely mediated by the low affinity basic microtubule binding domain. (D) Quantification of the median normalized GFP fluorescent intensity per microtubule. The gray rectangle indicates the 95% CI for the median normalized GFP intensity for areas with no microtubules in each condition (n > 100 microtubules per condition; N = 3; KW ANOVA with Tukey post-tests). No exogenous EB1 was added in the experiments shown in Figure 6A–D.

