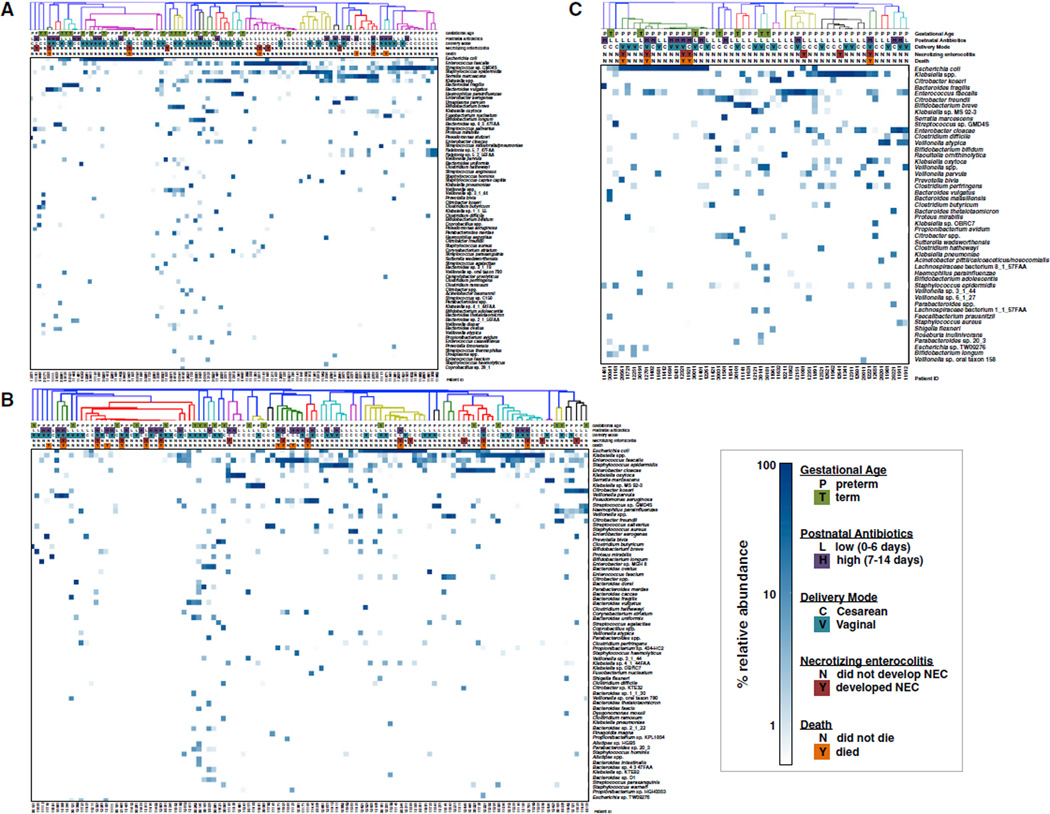
Figure 1. Species Composition and Relative Abundance in the Infant Gut.
(A) Days 3–9 postpartum.
(B) Days 10–16 postpartum.
(C) Days 17–22 postparum.
Species are ranked top to bottom by average relative abundance across samples. Species presented exhibit a minimum average relative abundance of 0.2% or achieve at least 5% relative abundance in at least one sample (complete abundance data in Table S1). Samples were hierarchically clustered with Bray-Curtis dissimilarity. Color indicates relative abundance on a logarithmic scale.

