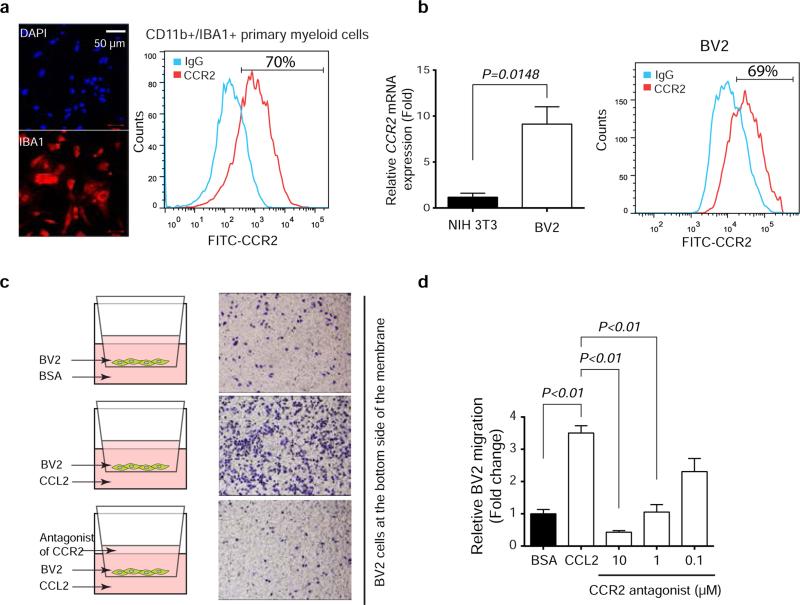
Extended Data Figure 8. CCR2-mediated Iba1+ myeloid cell directional migration.
a, Co-expression of Iba1 and CCR2 on myeloid cells freshly isolated from mouse brain by CD11b beads. Representative picture of immunofluorescence staining of Iba1 (left). FACS analysis of CD11b-positive cells for CCR2 expression. b, Relative CCR2 expression in the BV2 microglia cell line compared with NIH 3T3 fibroblasts. CCR2 mRNA level was analyzed by qRT-PCR (mean ± s.e.m., t-test) (left) and protein expression was analyzed by FACS (right). c, Transwell migration assay examining the directional migration of BV2 cells toward CCL2. 105 BV2 cells were seeded in the top chamber of the transwell units and CCL2 or BSA (20ng/ml) was added into serum-free media in the bottom chamber. The migrated cell numbers were counted at 24h. Next, CCR2 antagonists with different concentrations (10uM, 1uM, 0.1uM) were added into the top chamber with BV2 cells, and CCL2 (20ng/ml) was added into serum-free media in the bottom chamber. The migrated cell numbers were counted at 24h. d, Quantification of BV2 cell migration assay (means ± s.e.m., t-test).

