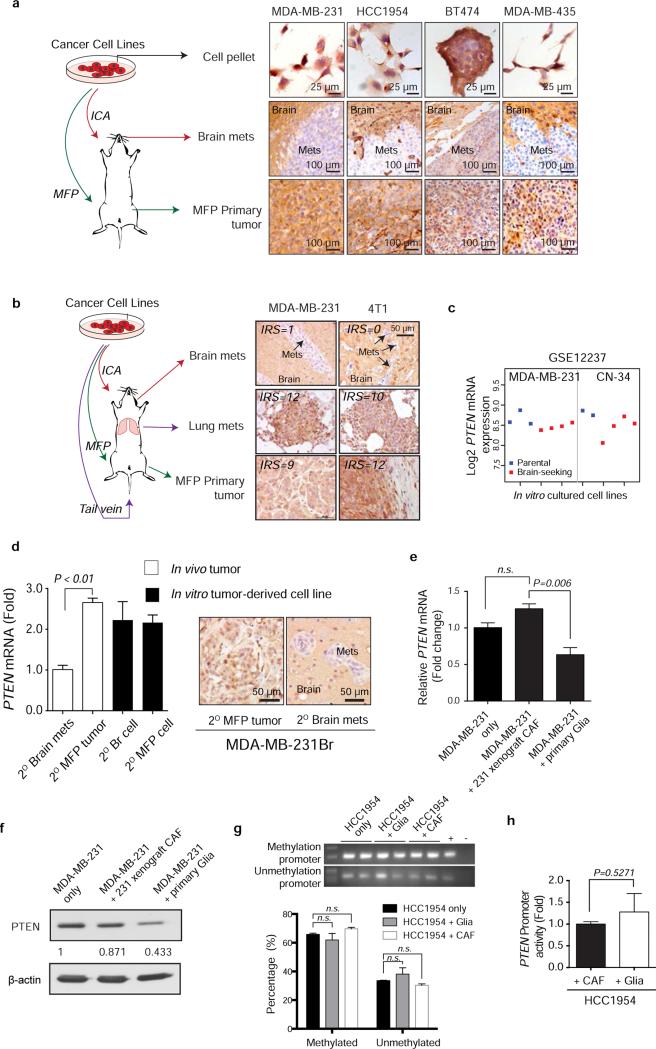
Extended Data Figure 2. PTEN expression in different metastatic organ microenvironments and in vitro culture condition.
a, Breast cancer cell lines (MDA-MB-231, HCC1954, BT474, and MDA-MB-435) were cultured and injected either to mammary fad pad (MFP) to form primary tumor or intracarotidly to form brain metastases. Cells pellets and tumor tissues were stained for PTEN expression by immunohistochemistry using anti-PTEN antibodies as done previously28. b, IHC staining of PTEN in brain metastases, paired lung metastases and primary tumor derived from either MDA-MB-231 or 4T1 cells. PTEN expression level was analyzed based on IRS scoring system. c, PTEN mRNA levels between parental MDA-MB-231 and CN-34 breast cancer cell lines (blue) and their brain-seeking sublines (red). Normalized PTEN-specific probe intensity values were extracted from cDNA microarray dataset GSE12237. Dot plot shows the mean probe intensity derived from independent RNA samples. d, PTEN qRT-PCR (mean ± s.e.m., t-test) and IHC in MDA.MB.231Br secondary tumors and cultured cells. e-f, qRT-PCR (e) and western blot (f) analysis of PTEN mRNA expression (mean ± s.e.m., t-test) or protein expression in MDA-MB-231 cells after co-culture with either primary mouse CAFs isolated from MDA-MB-231 xenograft tumors or primary mouse glia isolated from mouse brain. g, Representative methylation-specific PCR of PTEN promoter and quantification under co-culture with glia or CAF (mean ± s.e.m., t-test). h, PTEN promoter activity measured by luciferase reporter in HCC1954 cells after co-culture with either CAF or glia cells for 48 hours (mean ± s.e.m., t-test).

