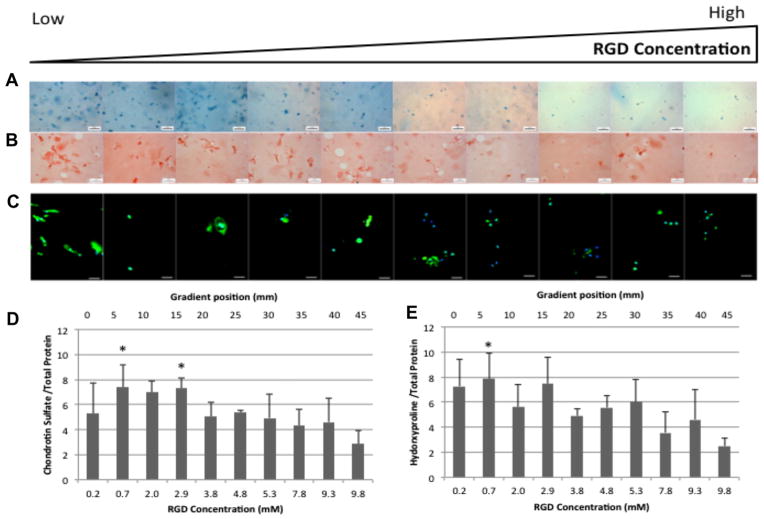
Fig. 5.
Extracellular matrix production by human chondrocytes after 3 weeks of culture. Images where taken every 5 mm down the length of the gradient. (A) Whole mount Alcian Blue staining. Scale bar = 200 μm. (B) Sirius red staining of histological sections. Scale bar = 50 μm. (C) Type 2 collagen (green) and nuclear (blue) immunofluorescence of histological sections. Scale bar = 25 μm. (D) Sulfated gylcosaminoglycan biochemical quantification for week 3. (E) Hydroxyproline biochemical quantification for week 3. *P-value ≤ 0.05 relative to the 9.8 mM RGD concentration (45 mm gradient position).

