
Figure 1.
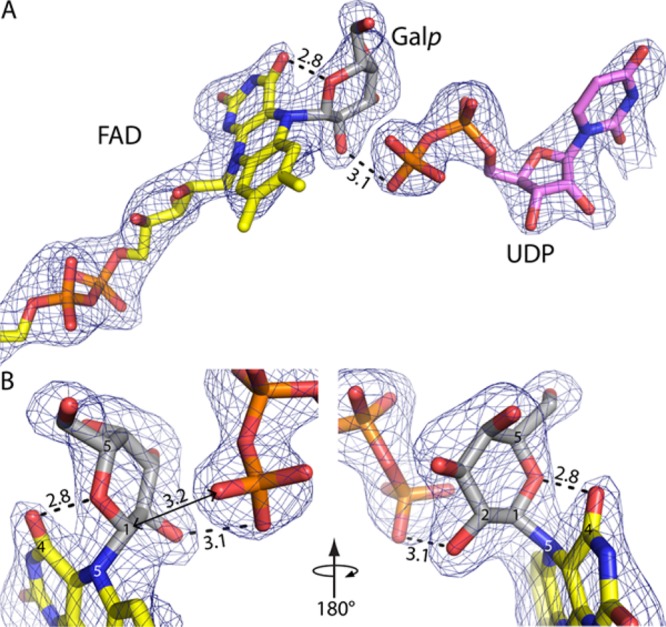
Electron density evidence of a covalent intermediate in the UGM reaction. The cage represents a simulated annealing Fo – Fc omit map contoured at 3σ. Prior to map calculation, the FAD, Galp, and UDP were deleted and simulated annealing refinement was performed. Distances are given in angstroms. (A) Overview of the ligands. FAD and Galp are colored yellow and gray, respectively. UDP is colored pink. (B) Close-up views of the covalent adduct. This figure and others were made with PyMOL.18