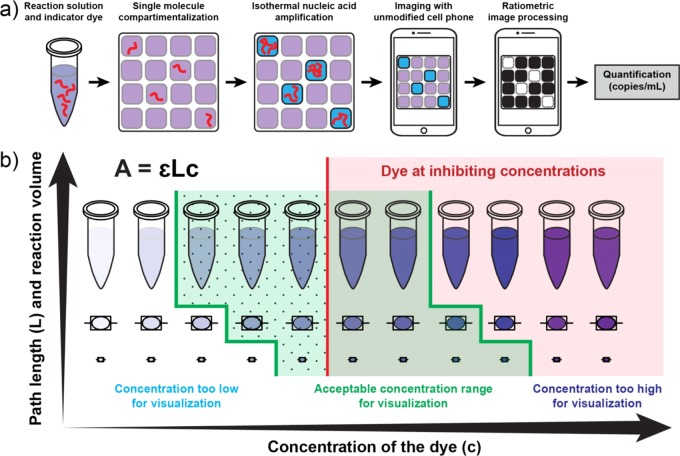
Figure 1.
A visual readout approach for digital single-molecule isothermal amplification for use with an unmodified cell phone camera. (a) A workflow for visual readout of digital single-molecule amplification. Single nucleic acid molecules are compartmentalized on a microfluidic device with indicator dye and followed by isothermal nucleic acid amplification. Positive reaction solutions are blue; negative reactions are purple. After ratiometric image processing, positive reactions become white and negative reactions become black, an unambiguous binary result. The number of positive wells is then used to quantify the concentration of the input target. (b) A diagram for delineating the optimal range of dye concentrations as a factor of path length (reaction volume) and the threshold for reaction inhibition. The green-shaded region indicates the range of acceptable dye concentrations for visualization with an unmodified cell phone camera. Concentrations to the left of the green region are too low for visualization; concentrations to the right of the green region are too high. Within this green region, the dotted area indicates dye concentrations that both enable readout with an unmodified cell phone camera and do not inhibit the amplification reaction. The area to the right of the red line indicates dye concentrations that interfere with amplification making accurate quantification based on real-time data challenging.

