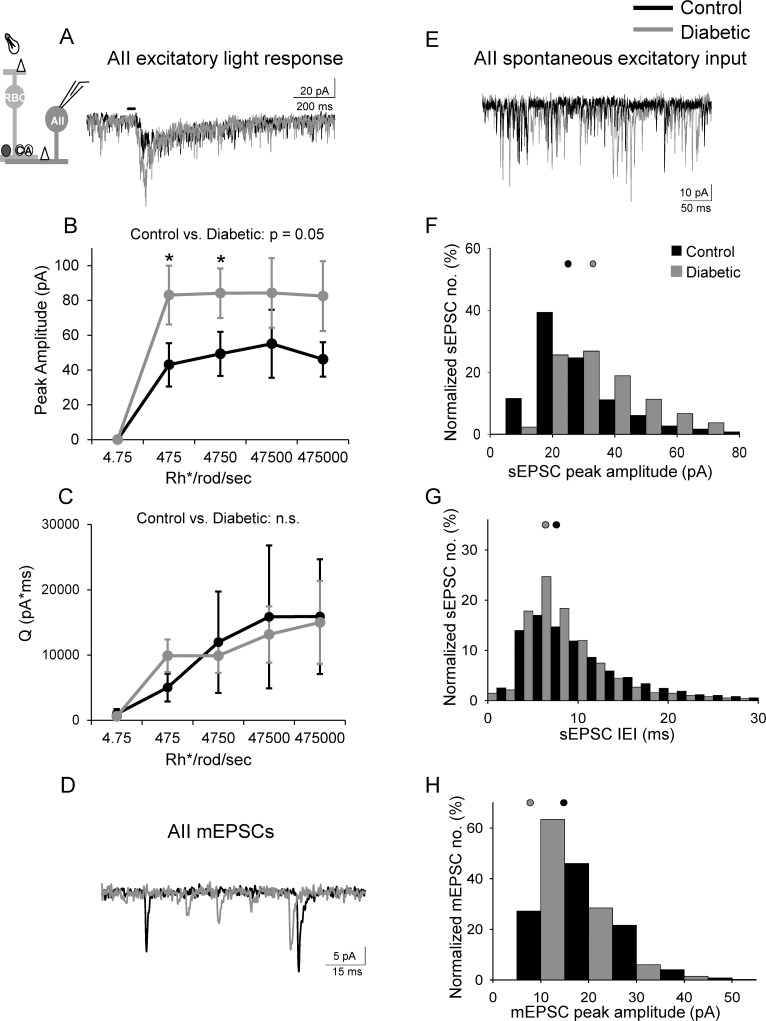
Figure 4.
Excitatory input from rod bipolar cells to downstream AII amacrine cells is increased in early diabetes. (A) Representative traces of L-EPSCs averaged from two responses at the 4750 Rh*/rod/sec light intensity recorded from AII amacrine cells after a 30-ms light stimulus (inset) are increased in diabetes. (B) The peak amplitudes are increased at multiple intensities in diabetic (n = 9 cells from 8 mice) AII amacrine cells compared to control (n = 7 cells from 5 mice, P = 0.05, 2-way ANOVA). (C) The magnitude (Q) of the L-EPSCS are similar (P = 0.2). (D, E) Spontaneous excitatory input from rod bipolar cells recorded from AII amacrine cells is increased in diabetic (gray trace) cells compared to control (black trace) determine by measuring mEPSCs (D) and sEPSCs (E). (F, G) Distribution of sEPSCs normalized to the number of events shows increased peak amplitudes (F) and reduced interevent intervals (G) in diabetic (n = 9 cells from 8 mice, 9859 events) cells compared to control (n = 7 cells from 5 mice, 6140 events; P < 0.0001 K-S test). (H) Distribution of mEPSCs show increased peak amplitudes in diabetic (n = 4 cells, 3995 events) cells compared to control (n = 4 cells, 2049 events; P < 0.0001 K-S test). Black and gray filled circles represent the median values for control and diabetic, respectively. *P < 0.05, n.s., not significant; black bar = light stimulus.

