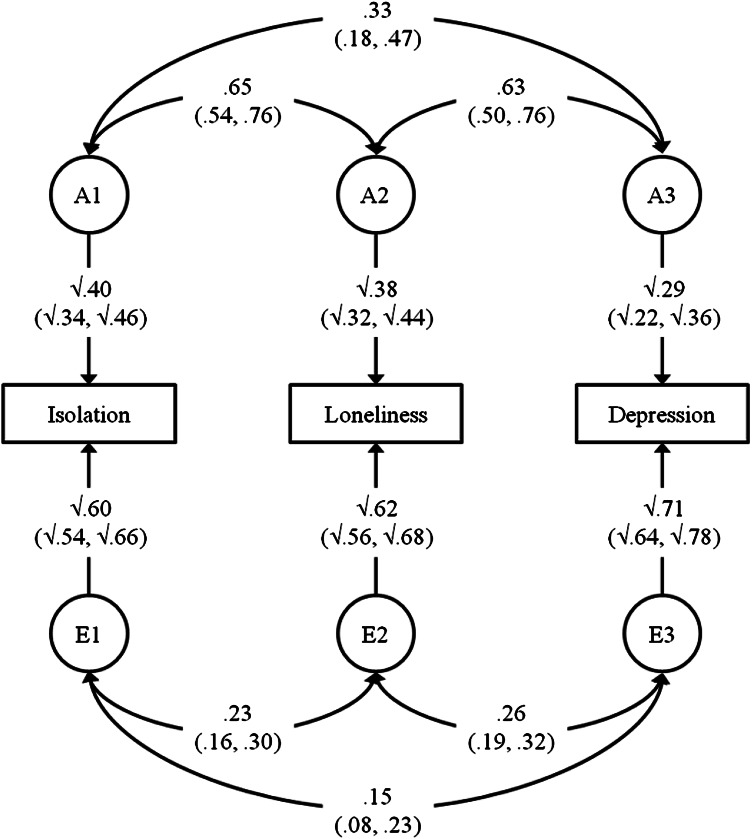
Fig. 1.
Correlated factors model separating the covariance between social isolation, loneliness and depression into additive genetic (A) and non-shared environment (E) components. Vertical arrows indicate the proportions of variance accounted for by the A and E factors. Double-headed arrows indicate the aetiological correlations between variables. 95 % confidence intervals are shown in brackets. The proportion of the phenotypic association between two variables that is accounted for by genetic influences can be calculated by multiplying the paths connecting the variables via their respective A factors, and dividing by the phenotypic correlation. For example, for isolation and loneliness this is calculated as (√0.40 × 0.65 × √0.38)/0.39 = 0.65

