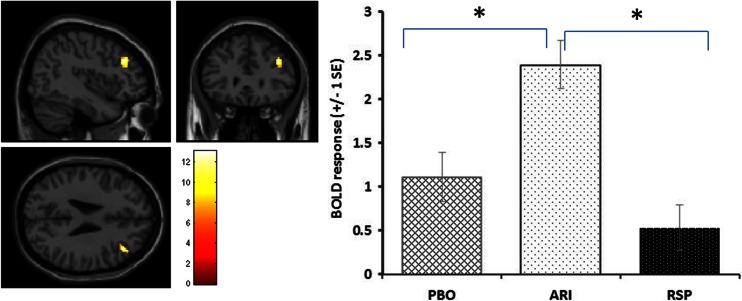
Fig. 3.
Brain images show the sagittal, coronal and axial views of the significant DLPFC cluster demonstrating a main effect of drug group (F-contrast image thresholded at p < 0.005). Histograms demonstrate the mean BOLD response within this cluster for the different drug groups. * = comparisons significant at pFWEc < 0.05 SVC for DLPFC in post hoc tests

