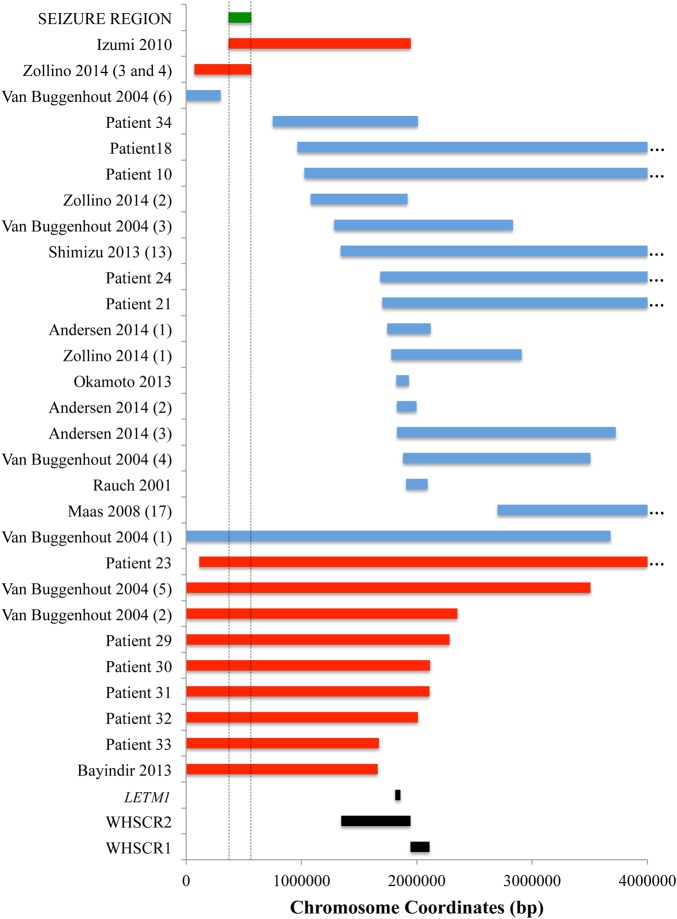
Figure 2.
Mapping a candidate seizure propensity region on chromosome 4. Bars show deletion sizes and locations of small 4p terminal or interstitial deletions in the 4p region that help define a 197 kbp seizure susceptibility region. The smallest region of overlap between three patients with seizures is shown as a green bar, ‘SEIZURE REGION’. This region is supported by patients from our cohort (patient numbers labelled on Y-axis) as well as from the literature who have deletions excluding the seizure region and lack seizures (blue indicates no seizures) and patients who have deletions including the seizure region who have seizures (red indicates a seizure phenotype). Patient data from the literature are indicated along the Y-axis by citation followed by the number of the patient as assigned in the citation in parentheses. Correspondingly, ‘Zollino 2014 (3 and 4)’ labels the size and location of the deletion shared by siblings, patients 3 and 4, in Zollino et al 27. Landmarks such as the Wolf–Hirschhorn syndrome (WHS) critical regions 1 and 2 (WHSCR1 and WHSCR2) are shown (black), as well as the location of the LETM1 gene (black). Coordinates are given in base pairs (bps) along the X-axis. Ellipses (…) indicate that the deletion extends further than shown. Chromosome coordinates for all deletions and regions shown in this figure are given in online supplementary table S4.

