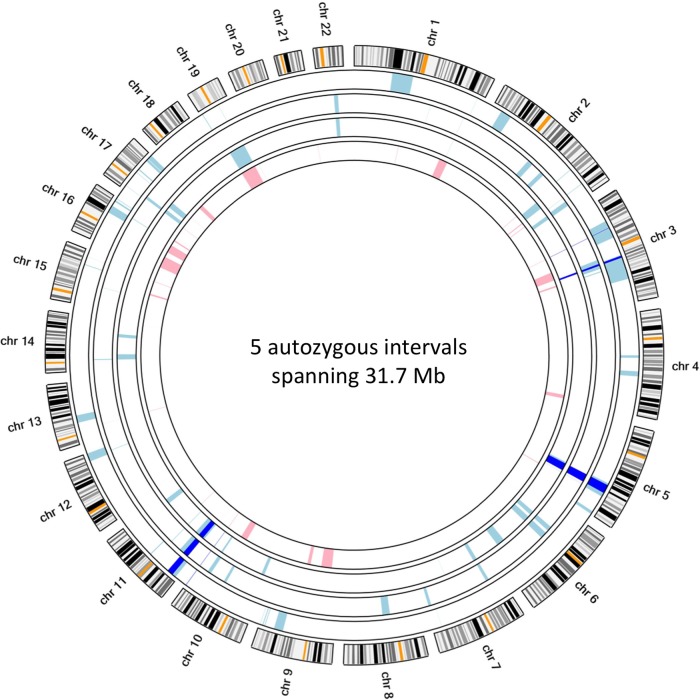
Figure 3.
Autozygous intervals shared between all three affected individuals (dark blue) are shown with respect to per-sample autozygous intervals identified in affected individuals (light blue) and the unaffected mother (pink). The concentric circles, beginning from the interior, represent samples II:2, III:2, III:1 and III:4.

