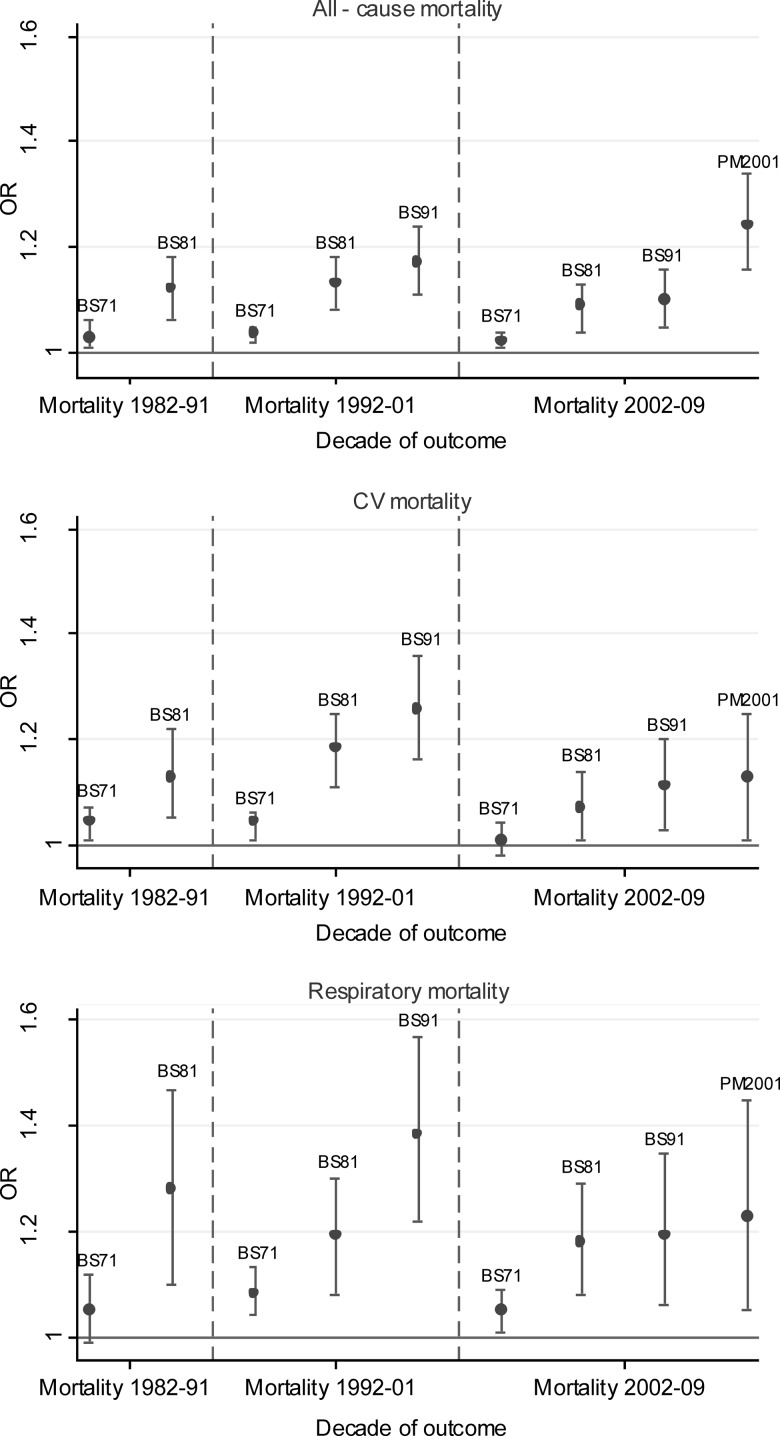
Figure 3.
ORs (95% CI) per 10 μg/m3 for BS exposure in 1971, 1981 and 1991 and PM10 in 2001 and mortality in each subsequent decades. Adjusted for age and sex, social class of individual and area, population density and geographical region. Source: ONS Longitudinal Study (authors’ own work). CV, BS, black smoke; cardiovascular disease; ONS, Office for National Statistics.

