Figure 1.
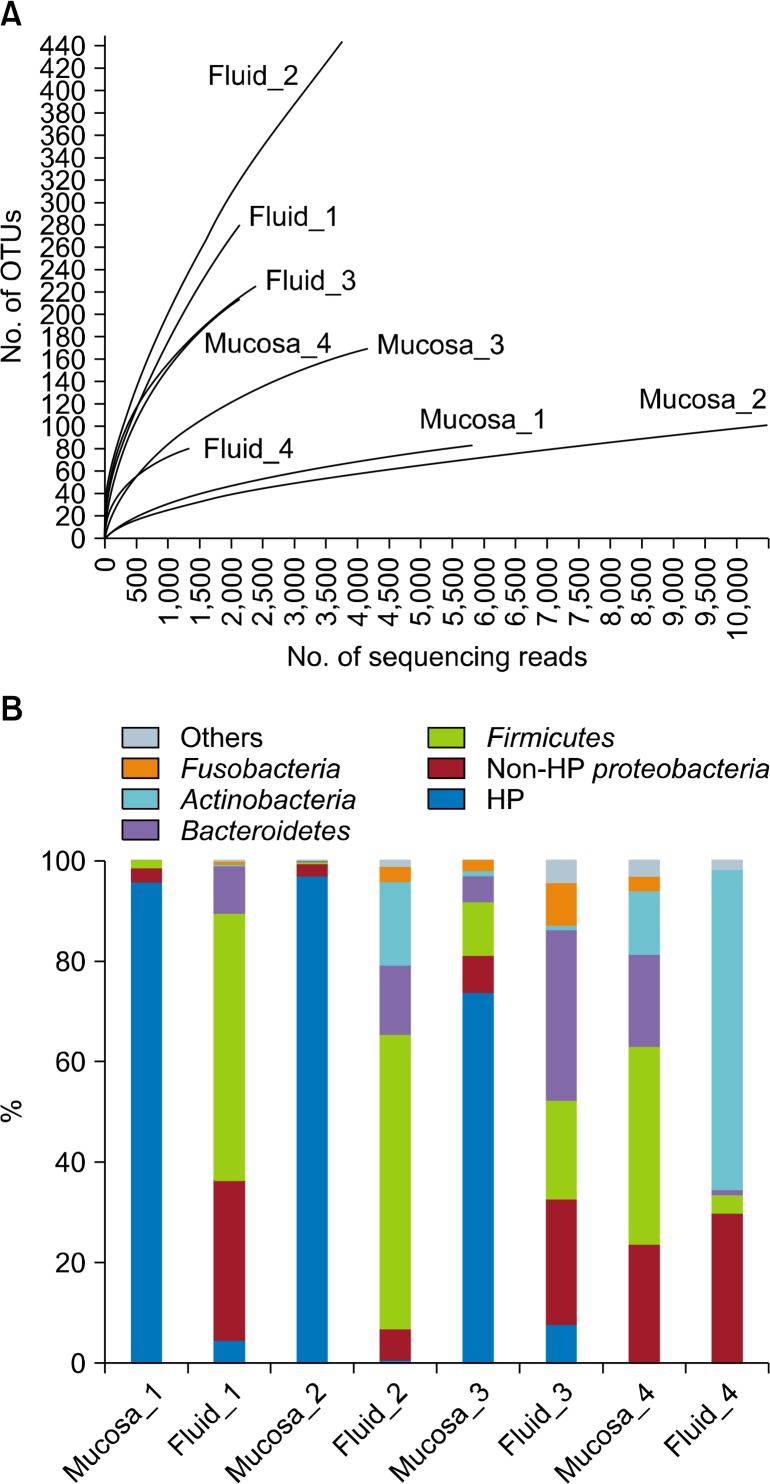
(A) Rarefaction curve and composition of phylum in the gastric mucosa and gastric fluid samples. The rarefaction curve indicates the bacterial community in the gastric fluid samples and mucosa samples (1–3, Helicobacter pylori [HP] (+) sample; 4, HP (−) sample). OTUs stands for operational taxonomic units. (B) The phylum composition between gastric mucosa samples and gastric fluid samples.

