
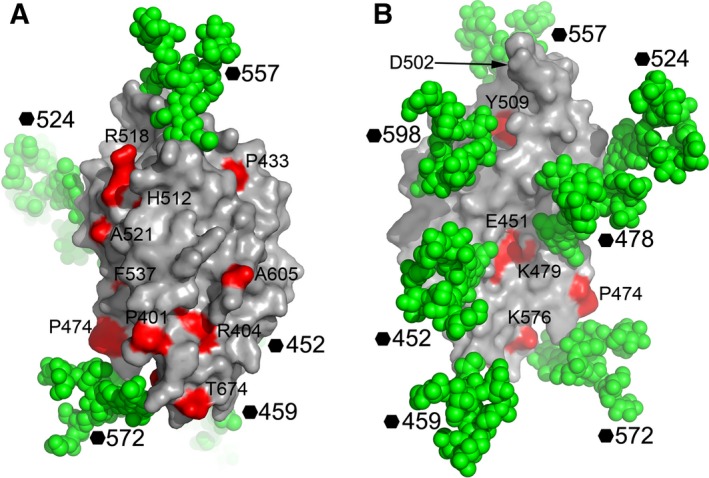
Figure 2.
NPC1DC surface mapped with NPC disease mutations. (A) Man9GlcNAc2 is modelled at all seven glycosylation sites of NPC1DC with atoms shown as green spheres on the molecular surface to show glycan‐free areas on the protein. The residues mutated in NPC patients are coloured in red and labelled. The molecule is shown in a similar orientation to Fig. 1A. (B) 180° rotation of (A) showing the back of the molecule. Residue 502, critical for EBOV GP interactions is indicated by an arrow.