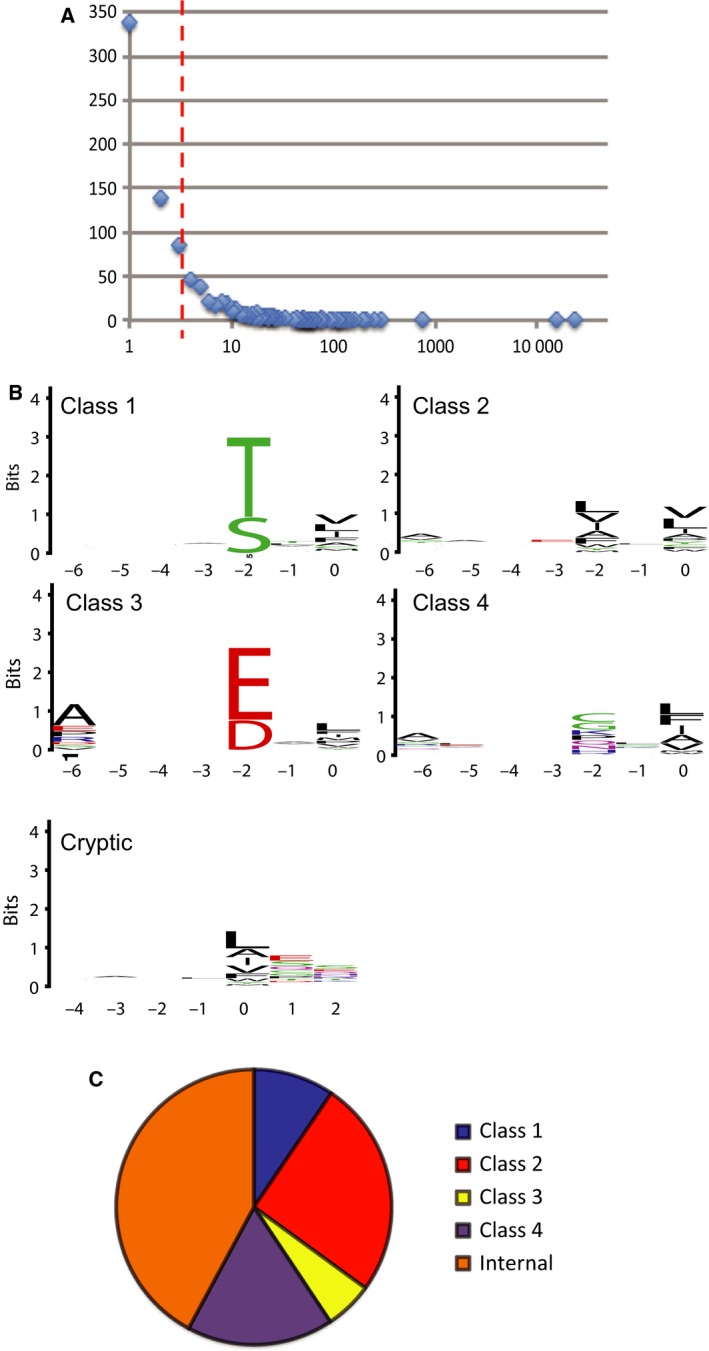
Figure 1.

Analysis of the ProP‐PD selection data. (A) Histogram of the next‐generation sequencing data of the phage pools after the fourth and fifth round of selections, with the number of sequencing counts on the x‐axis and the number of peptides receiving a certain number of counts on the y‐axis. (B) PWMs representing the peptide binding specificity of syntenin PDZ1‐2. The numbers on the x‐axis indicate the position in the peptide following the typical PDZ ligand nomenclature, with p0 typically being the C‐terminal residue. The relative sized of the letters indicate their occurrences among the aligned sequences. The high of the stacked letters indicate the information content at the position given in bits. (C) Pie chart of the binding motifs assigned among syntenin ligands identified through ProP‐PD.
