

Abstract
The epithelial–mesenchymal transition (EMT) is associated with tumor progression. We reported previously that expression of the δEF1 family proteins (δEF1/ZEB1 and SIP1/ZEB2), key regulators of the EMT, is positively correlated with EMT phenotypes and aggressiveness of breast cancer. Here, we show that the expression levels of regulator of G‐protein signaling 16 (RGS16) are negatively correlated with those of the δEF1 family proteins. On the basis of the results of gain‐ and loss‐of‐function analyses, we suggest that δEF1 family proteins promote cell motility of breast cancer cells directly or indirectly through repressing expression of RGS16.
Keywords: epithelial–mesenchymal transition, regulator of G‐protein signaling 16, smad‐interacting protein 1, δEF1, δEF1 family proteins
Abbreviations
- EMT
epithelial–mesenchymal transition
- RGS
regulator of G‐protein signaling
- SIP1
smad‐interacting protein 1
- δEF1
δ‐crystallin/E2‐box factor1/zinc finger E‐box binding homeobox (ZEB) 1
Highlights.
RGS16 is highly expressed in breast cancer cells of the luminal subtype.
RGS16 is expressed at low levels in breast cancer cells of the basal‐like subtype.
The expression profile of RGS16 is reciprocal to those of the δEF1 family proteins.
δEF1 family proteins downregulate expression of RGS16.
RGS16 negatively controls cell motility promoted by δEF1 family proteins.
Upon ligand stimulation, G‐protein‐coupled receptors transmit signals by catalyzing exchange of GDP with GTP on the α subunit of their associated heterotrimeric G proteins. Interactions between the GTP‐bound form of the α subunit and effectors initiate intracellular signaling cascades. By contrast, deactivation of these signals is regulated by the intrinsic GTPase activity of the α subunit, which is promoted by GTPase‐activating proteins (GAPs) and the regulator of G‐protein signaling (RGS) proteins. In mammals, the RGS family consists of more than 30 proteins, and its members share high sequence similarity within the conserved RGS domain that confers GAP activity 1. RGS16, which was initially purified from the retina, has been implicated in negative regulation of the MAPK, PI3K/Akt, RhoA and SDF‐1/CXCR4 pathways in normal and cancer cells 1. Recent studies revealed a role for RGS16 signaling in multiple cancers. The RGS16 locus is a site of genomic instability in around half of primary breast tumors (50% of 222 tumors studied), and knockdown of RGS16 in breast cancer cells promotes proliferation in response to epidermal growth factor (EGF) 2, 3. In addition, tissue microarray analysis revealed that expression of RGS16 is lower in pancreatic cancer with lymph node metastases than in nonmetastasized cancer, and that loss of RGS16 is associated with reduced patient survival 4. Thus, RGS16 seems to act as a tumor suppressor.
The process of cancer‐cell invasion involves the loss of cell–cell interactions along with acquisition of motile properties, and is often associated with the epithelial–mesenchymal transition (EMT) 5. Formation of tight cell–cell adhesions depends primarily on the E‐cadherin system. Transcriptional repression of E‐cadherin, frequently observed in malignant tumors, is mediated by the δEF1 family of two‐handed zinc‐finger factors (δEF1/ZEB1 and SIP1/ZEB2), proteins of the Snail family (Snail, Slug and Smuc), and basic helix‐loop‐helix factors (Twist and E12/E47)5. These factors, which are overexpressed in cancer cells, induce the EMT and promote development of metastatic properties such as migration and invasion. However, it remains unclear how they regulate G proteins during these processes.
Based on the results of gene expression profiling, human breast cancers are classified into two subtypes, luminal and basal‐like, corresponding to the two distinct types of epithelial cells found in the normal mammary gland 6, 7. The luminal subtype, which is generally estrogen receptor– and progesterone receptor–positive, exhibits relatively low malignancy and favorable prognosis. By contrast, the basal‐like subtype is associated with aggressive behavior and poor prognosis, and typically does not express estrogen receptor, progesterone receptors, or ERBB2 (the ‘triple‐negative’ subtype). Basal‐like tumors have been further categorized into two subtypes, basal A and basal B 6. The basal A subtype has a basal‐like signature and is positive for basal cytokeratin (K5/K14), whereas the basal B subtype exhibits a stem cell–like expression profile. We recently found that expression of E‐cadherin was negatively correlated with both progression of breast cancer and expression of the δEF1 family proteins 8. Indeed, most cell lines with low E‐cadherin levels and high δEF1/SIP1 levels are categorized into the basal‐like subtype. Cells of the basal B subtype expressed much higher levels of δEF1/SIP1 than cells of the basal A subtype. Moreover, tumor samples exhibited positive cytokeratin 19 (K19) staining in cancer cells within tumor nests; by contrast, δEF1 family proteins were not detected in typical tumor cells, but were clearly detected in stromal cells and spindle‐shaped cells in degenerated tumor nests 8, 9.
In this study, we examined the expression of RGS16 in various breast cancer cells, and found that RGS16 was expressed at high levels in the luminal subtype of breast cancer cells, and at low levels in the basal‐like subtype. Overexpression of RGS16 in the basal‐like subtype altered cellular morphology without dramatically affecting expression of EMT marker proteins, and also ameliorated invasive properties. By contrast, siRNA against RGS16 promoted invasion by cells of the luminal subtype. Knockdown of δEF1 upregulated the expression of RGS16 and reduced cell motility in cells of the basal‐like subtype, and this phenotype was partially rescued by siRNA against RGS16. We suggest that RGS16 is negatively involved in cell motility mediated by δEF1, and would act as a suppressor of cancer cell aggressiveness.
Materials and methods
Cell culture, reagents and antibodies
All cells used in this study were from the American Type Culture Collection (Manassas, VA, USA). MCF7, MDA‐MB231, Hs578T and BT549 cells were cultured in Dulbecco's modified Eagle's medium (DMEM; Nacalai Tesque, Kyoto, Japan) with 10% fetal bovine serum (FBS), 100 U·mL−1 penicillin, 100 μg·mL−1 streptomycin and 100 μg·mL−1 gentamicin. For culture of Hs578T cells, the medium was supplemented with 10 μg·mL−1 insulin. To produce lentivirus, HEK293FT cells were cultured in DMEM supplemented with 10% FBS, 2 mm l‐glutamine, 0.1 mm MEM nonessential amino acids (Invitrogen, Carlsbad, CA, USA) and 1 mm MEM sodium pyruvate (Invitrogen). Mouse monoclonal anti‐Flag M2 and α‐tubulin antibodies were purchased from Sigma‐Aldrich (St. Louis, MO, USA). Mouse monoclonal antibodies against E‐cadherin, N‐cadherin and fibronectin were purchased from BD Transduction Laboratories (Lexington, KY, USA). Mouse monoclonal antibody against vimentin, and rabbit polyclonal antibodies against ZEB1 and SIP1 were from Dako (Tokyo, Japan) and Novus Biologicals (Littleton, CO, USA) respectively.
RNA interference
Transfection of siRNA was performed using RNAiMAX (Invitrogen). siRNAs and shRNAs against human δEF1 and human SIP1 were described previously 8. siRNAs against human RGS16 were obtained from Invitrogen (Stealth RNAi NM002928). siRNAs were used at a final concentration of 20 nm.
RNA isolation and quantitative RT‐PCR analysis
Total RNA was prepared using ISOGEN (Nippon Gene, Tokyo, Japan) and reverse transcribed using the Prime Script First Strand cDNA Synthesis Kit (TAKARA BIO, Otsu, Japan). Quantitative RT‐PCR (qRT‐PCR) analysis was performed using the Power SYBR Green Master Mix (Applied Biosystems, Foster City, CA, USA). All expression levels were normalized against the level of human glyceraldehyde‐3‐phosphate dehydrogenase (GAPDH) mRNA in the same sample. To perform qRT‐PCR analyses, transfection and infection were performed in cells seeded in two wells of the tissue culture plate. mRNAs were independently extracted from the cells, and each split into three wells of 96‐wells to measure endogenous mRNA levels by qRT‐PCR. We repeated these experiments at least two times, and representative results are shown in figures. The primers used were described previously 8, except for RGS16: forward, 5′‐CAAGACACGTCTGGGGATCT‐3′, reverse5′‐CAGGTCGAACGACTCTCTCC.
Lentiviral production, infection and immunoblotting
The procedures used for lentiviral production, infection and immunoblotting were described previously 10. Lentiviral infection was performed in cells seeded in a well of the tissue culture plate and repeated at least three times with lentiviruses, which were independently prepared for each experiment. Cells were lysed in lysis buffer solution (20 mm Tris‐HCl [pH 7.5], 150 mm NaCl, 1 mm EDTA, 1 mm EGTA, 1% Nonidet P‐40 and protease inhibitors). After measurement of protein concentration, equal amounts of total protein per lane were subjected to SDS/PAGE, followed by semidry transfer of the proteins to Fluoro Trans W membrane (Pall, GlenCove, NY, USA). Immunodetection was performed using the ECL blotting system and Luminescent Image Analyzer (LAS4000; Fujifilm, Tokyo, Japan).
Cell invasion and proliferation assays
Boyden chamber migration assays were conducted using transparent PET membrane 24‐well 8.0‐μm pore size cell culture inserts (BD Falcon, Franklin Lakes, NJ, USA) coated with collagen type I‐C (Nitta Gelatin, Osaka, Japan). After MDA‐MB231, BT549, T47D and MCF7 cells were seeded in triplicate on the inserts, the cells that had not invaded into the lower surface of the filters were removed from the upper face of the filters using cotton swabs. The cells that had invaded into the lower surface of the filters were fixed in methanol and acetone and stained with Giemsa. Invasion was quantified by visually counting photographed cells, which had invaded, in several fields (Figs 2D, 3D and 4C), or by counting all cells which had invaded (Fig. 4D), followed by statistical analyses. For proliferation assays, at 24 h after infection cells were trypsinized, counted and reseeded in triplicate in 6‐well plates (0 day), followed by further culture for 6 days. After trypsinization, cell proliferation was determined by counting cells with a hemocytometer and evaluated by statistical analyses.
Figure 2.
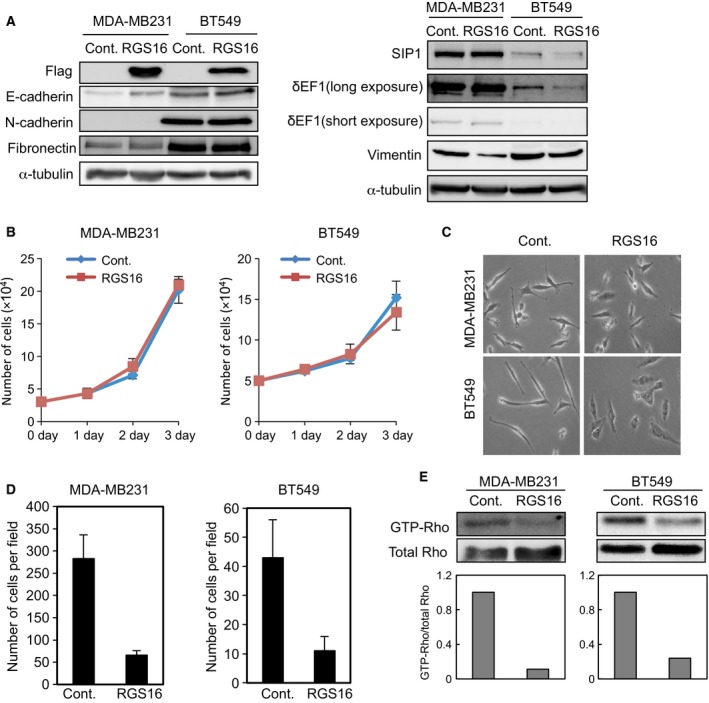
Overexpression of RGS16 affects cell morphology and invasion of breast cancer cells. (A) MDA‐MB231 and BT549 cells were infected with lentiviruses encoding negative control or RGS16, followed by immunoblot analyses with the indicated antibodies. α‐tubulin levels were monitored as a loading control. Results are representative of at least three experiments. (B–D) Cells infected with lentiviruses encoding negative control or RGS16 were counted using a hemocytometer (B), and analyzed by phase‐contrast microscopy (C) and Boyden chamber invasion assays (D). Each value in (B) and (D) represents the mean ± SD of triplicate determinations from a representative experiment. Similar results were obtained at least three independent experiments with cells infected with lentiviruses which were prepared for each experiment. (E) Levels of GTP‐Rho. GTP‐Rho in the cell lysate used in (A) was first separated using an affinity‐based procedure, and the cell lysates were also separated by SDS/PAGE, followed by immunoblot analyses using anti‐Rho antibody. The ratio of GTP‐Rho to total Rho was validated by densitometric analyses and shown at the bottom. Results are representative of four independent experiments, three others of which are shown in Fig. S1B.
Figure 3.
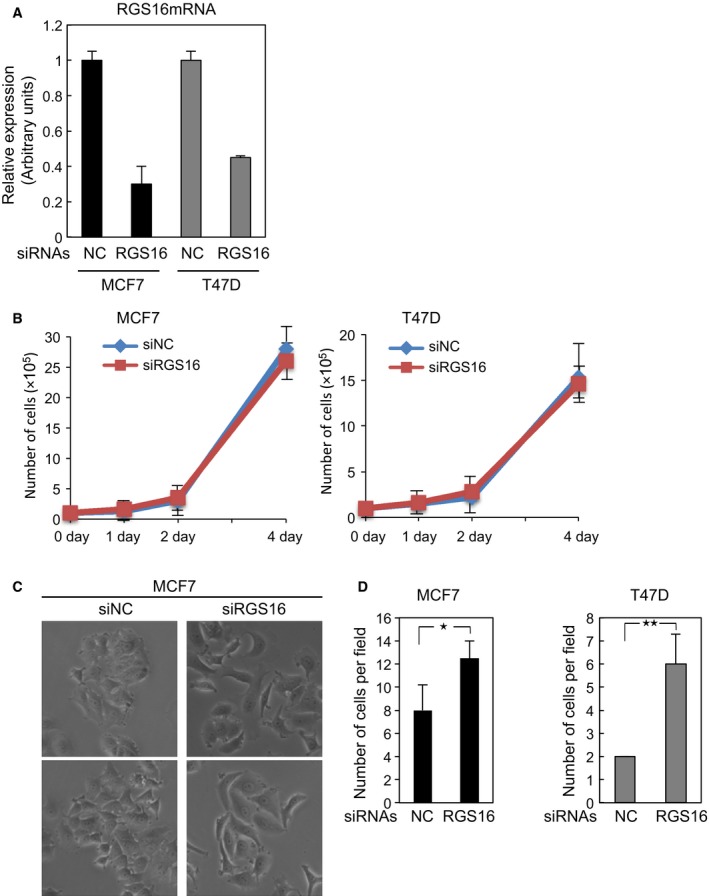
RGS16 siRNA affects cell morphology and invasion of breast cancer cells. (A) MCF7 cells were transfected with RGS16 or negative control (NC) siRNAs. The transfected cells were analyzed by qRT‐PCR (A), counted using a hemocytometer (B), observed by phase‐contrast microscopy (C) and subjected to Boyden chamber invasion assay (D). Each value in (A) and (B) and (D) represents the mean ± SD of triplicate determinations from a representative experiment. Similar results were obtained at least three independent experiments with cells transfected with RGS16 or NC siRNAs. Mann–Whitney U‐test, *P < 0.05, **P < 0.01.
Figure 4.
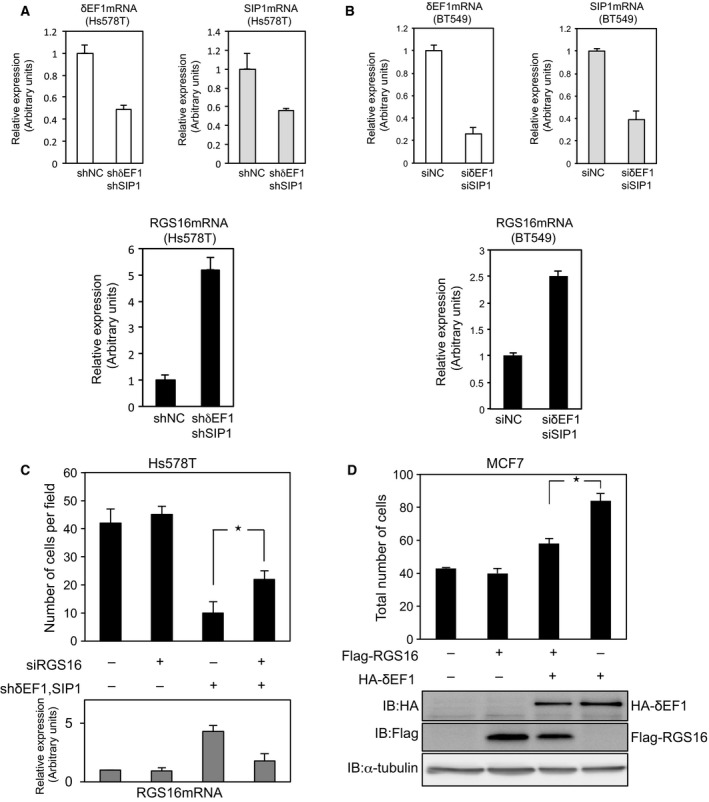
Expression of RGS16 is regulated by δEF1 family proteins. (A, B) Transfection with δEF1/SIP1 or negative control (NC) siRNAs and infection with lentiviruses (prepared for each experiment) were performed at least three times. The cells were analyzed by qRT‐PCR to measure expression of δEF1,SIP1, and RGS16 mRNAs. (C) The cells infected with shRNAs against δEF1 and SIP1 (used in A) were subjected to Boyden chamber invasion assays. Bottom panels show RGS16 mRNA levels. Mann–Whitney U test, *P < 0.05 (D) MCF7 cells were infected with the indicated constructs, and then subjected to Boyden chamber invasion assays. Bottom panels show the levels of the indicated tagged proteins. Each value represents the mean ± SD of triplicate determinations from a representative experiment. The results of three independent experiments with triplicates were statistically analyzed with the analysis of variance (ANOVA). The analysis clearly indicated that RGS16 significantly inhibited δEF1‐induced migration with P value of 7.37 × 10⁻⁵ (shown as an asterisk).
Rho activation assay
Rho activation assays were performed using the Rho Activation Assay Kit (Millipore, Billerica, MA, USA). Briefly, cells infected with lentiviral vector encoding negative control or RGS16 were washed two times with ice‐cold PBS and then lysed in MLB buffer supplemented with 1 mm PMSF. One milligram of total protein was then incubated with 30 μL of Rho Assay Reagent slurry for 45 min. After pull‐down, the complexes were washed and subjected to SDS/PAGE. The amount of GTP‐Rho was determined by immunoblot analyses using Rho‐specific antibody (Millipore). Total cell lysates were also separated by SDS/PAGE, followed by immunoblotting using the same anti‐Rho antibody.
Results
Expression of RGS16 in human breast cancer cells
Although RGS16 is thought to be a tumor suppressor gene, it is expressed in cancer cells 2. To investigate its roles in cancer cells, we studied various kinds of breast cancer cells, because they are the best characterized in EMT studies. As noted above, breast cancer cells can be classified into two subtypes based on their gene expression profiles. We evaluated the expression of RGS16 in 21 human breast cancer cell lines. In preliminary experiments, we characterized several commercially available antibodies in immunoblot analyses, but found that they were of insufficient quality to detect endogenous proteins. Therefore, rather than measuring protein levels, we measured mRNA levels by qRT‐PCR using mRNA samples described in our previous study 8. Figure 1 shows that RGS16 was highly expressed in breast cancer cells of the luminal subtype, and expressed at lower levels in cells of the basal‐like subtype, suggesting that RGS16 expression is negatively correlated with aggressiveness.
Figure 1.
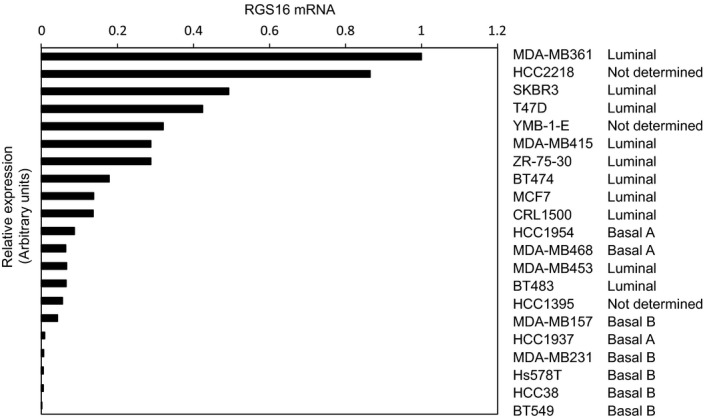
Expression profiles of RGS16 in breast cancer cells. RGS16 mRNA levels were determined by qRT‐PCR in 21 human breast cancer cell lines. The collection of cell lines shown here was reported by Neve et al. 6 and Charafe‐Jauffret et al. 7.
Involvement of RGS16 in cell motility
To investigate the molecular function of RGS16 in breast cancer cells, we generated lentiviral vector encoding Flag‐tagged RGS16 and infected two cell lines of the basal‐like subtype, MDA‐MB231 and BT549. Three days after infection, we examined the levels of ectopic expression of RGS16 by immunoblot analyses using anti‐Flag antibody (Fig. 2A). Overexpression of RGS16 was clearly observed in both cell lines. Protein expression of E‐cadherin was slightly upregulated by ectopic expression of RGS16 in both cells, which was accompanied with an elevated mRNA level only in MDA‐MB231 cells (Fig. 2A and Fig. S1A). Vimentin expression was decreased at the protein level in both cell lines, whereas other EMT markers, such as N‐cadherin, fibronectin, δEF1, SIP1, Snail and Slug, were hardly regulated at either the protein or mRNA level by RGS16 overexpression (Fig. 2A and Fig. S1A, and data not shown). Cell proliferation was not affected by overexpression of RGS16 (Fig. 2B), but cell morphology was slightly altered, from a long spindle‐like shape to a cobblestone‐like or short spindle‐like shape (Fig. 2C). Overexpression of RGS16 reduced invasive properties and the amount of the GTP‐bound forms of Rho family proteins (Fig. 2D,E and Fig. S1B). These findings indicate that RGS16 regulates cell morphology without significantly affecting EMT marker proteins, and also inhibits motility in breast cancer cells.
Promotion of cell motility by siRNA against RGS16
We next examined the effect of RGS16 siRNA on two breast cancer cell lines of the luminal subtype, MCF7 and T47D. The siRNA successfully knocked down endogenous RGS16, as demonstrated by qRT‐PCR analyses (Fig. 3A). In cells transfected with RGS16 siRNA, proliferation was almost equal to that in cells transfected with control siRNA (Fig. 3B). Similar observations were also made in cells that overexpressed RGS16 (Fig. 2B), suggesting that RGS16 is not involved in proliferation in breast cancer cells. However, RGS16 siRNA considerably altered cell morphology, from a cobblestone‐like shape to a spindle‐like shape with protrusions, in both cell lines (Fig. 3C and data not shown). Invasion capacity was elevated in cells transfected with RGS16 siRNA (Fig. 3D). Although RGS16 overexpression slightly upregulated E‐cadherin expression (Fig. 2A), RGS16 siRNA did not significantly affect expression levels of representative EMT markers, including E‐cadherin, at protein and mRNA levels (data not shown). These findings suggest that RGS16 inhibits cell motility in breast cancer cells of the luminal subtype.
Regulation of RGS16 expression by δEF1 and SIP1
We previously reported that most cells of the luminal subtype express low levels of δEF1 and SIP1, whereas that most cells of the basal‐like subtype express these proteins at high levels 8. Because δEF1 and SIP1 act as transcriptional repressors during the EMT 11, these observations prompted us to investigate whether δEF1 and SIP1 regulate expression of RGS16 in breast cancer cells. Among the breast cancer cell lines we examined, Hs578T and BT549 cells expressed the highest levels of δEF1 and SIP1 mRNA and protein 8, 9. As δEF1 and SIP1 are functionally redundant 8, 11, we simultaneously knocked down both proteins in Hs578T and BT549 cells (Fig. 4A,B). To achieve optimal knockdown efficiency, Hs578 cells were infected with lentiviruses encoding shRNAs against both δEF1 and SIP1, and BT549 cells were transfected with the corresponding siRNAs. As expected, RGS16 expression was elevated in the knockdown cells (Fig. 4A,B). Hs578T cells in which both δEF1 and SIP1 were knocked down exhibited reduced invasion capacity, which was partially restored by RGS16 siRNA (Fig. 4C). Similar findings were also observed in BT549 cells (data not shown). Conversely, the elevation of invasion capacity by overexpression of δEF1 was reduced by ectopic expression of RGS16 in MCF7 cells (Fig. 4D). These findings suggest that downregulation of RGS16 negatively influences cell motility promoted by δEF1 family proteins.
Discussion
In this study, we detected high levels of RGS16 expression in the luminal subtype of breast cancer (Fig. 1), consistent with a previous report by Liang et al. 2 that used MCF7 cells. Those authors also showed that RGS16 siRNA regulates proliferation by inducing Akt phosphorylation in serum‐starved MCF7 cells only after stimulation with EGF or serum. Under our culture condition, in which cells were maintained in the presence of 10% FBS, RGS16 did not affect proliferation of four kinds of breast cancer cells (Figs 2B and 3B). Indeed, Akt was constitutively phosphorylated in these cells, and was not considerably altered by knockdown or overexpression of RGS16 (data not shown). By contrast, Miyoshi et al. 12 demonstrate that RGS16 is a predictive marker for prognosis of colorectal cancer. They showed that RGS16 is highly expressed in some, but not all, cancer cell lines, and that it is expressed at higher levels in cancer tissues than in normal tissues. Cancer cells in tumor nests highly expressed RGS16 and epithelial cytokeratins 8, 12. Taken together, these findings suggest that in noninvasive cancer cells, like MCF7 cells, RGS16 is expressed and regulates cell proliferation if it induces Akt phosphorylation. On the other hand, RGS16 is likely to be downregulated to promote cell motility in cells at the invasive front of cancer tissues.
We showed here that expression of RGS16 is downregulated by δEF1 family proteins (Fig. 4). δEF1 family proteins act as transcriptional repressors during EMT of epithelial and cancer cells 5, during which they bind directly to the promoter regions of E‐cadherin and epithelial splicing regulatory proteins (ESRPs) 8; ESRPs mediate alternative splicing of mRNAs of numerous genes of epithelial cells. Thus, the δEF1 family proteins modulate various biological events during the EMT by regulating transcription and alternative splicing of genes 13. Among the various events dependent on δEF1 family proteins, the molecular mechanisms underlying cell motility are not well understood. In this study, we showed that δEF1 family proteins suppressed expression of RGS16 and in turn promoted invasion by cancer cells, suggesting that RGS16 is negatively involved in cell motility mediated by δEF1 family proteins.
We previously reported that Ets1 induces δEF1 expression and activates δEF1‐promoter driven luciferase activity in mouse epithelial NMuMG cells 11. We also found that Ets1 siRNA inhibits δEF1 expression in NMuMG cells 11 and that ERK is constitutively phosphorylated in the basal‐like subtype of breast cancer cells 14. Notably, Ets1 has been identified as a novel marker of the basal‐like subtype 6, 15. Because Ets1 is phosphorylated and activated by the ERK signaling pathway 16, phosphorylated Ets1 in the basal‐like subtype seems to play an important role in upregulation of δEF1, and in turn suppression of RGS16, thereby maintaining aggressiveness of the basal‐like subtype of breast cancer.
The results of this study suggest that RGS16 is overexpressed in the luminal subtype of breast cancer cells, which exhibits low malignancy and good prognosis. Conversely, the basal‐like subtype of breast cancer cells, which exhibits aggressive behavior and poor prognosis, expresses lower levels of RGS16. δEF1 family proteins inhibit RGS16 expression, which may contribute to the promotion of cell motility by these proteins. Thus, it appears that RGS16 acts as a suppressor of tumorigenesis during early stage of cancer, whereas low expression contributes to aggressiveness during cancer progression.
Author contributions
MS and KM conceived and supervised the study; MS designed experiments and wrote the manuscript; YH, KE, TS, AF and MS performed experiments and analyzed data; MS made manuscript revisions.
Supporting information
Fig. S1. (A) Overexpression of RGS16 slightly affects expression of EMT markers. MDA‐MB231 and BT549 cells were infected with lentiviruses encoding negative control or RGS16, followed by qRT‐PCR. Each value represents the mean ± SD of triplicate determinations from a representative experiment. Similar results were obtained at least three independent experiments. (B) Levels of GTP‐Rho in RGS16‐overexpressd cells. As with Fig. 2E, after Rho activation assays in three independent experiments (1st, 2nd and 3rd), the ratio of GTP‐Rho to total Rho was validated by densitometric analyses and shown at the bottom.
Acknowledgements
We thank Dr Kana Horiguchi for providing siRNAs, expression plasmids, and lentiviral vectors, and Dr Kohei Miyazono for valuable discussion. We thank Dr Tatsuhiko Saigoh for statistical analyses. This study was supported by JSPS KAKENHI Grant Number 24390419, and the JSPS Core‐to‐Core Program ‘Cooperative International Framework in TGF‐β Family Signaling'. This study was also supported by the Astellas Foundation for Research on Metabolic Disorders and the Kobayashi Foundation for Cancer Research.
References
- 1. Bansal G, Druey KM and Xie Z (2007) R4 RGS proteins: regulation of G‐protein signaling and beyond. Pharmacol Ther 116, 473–495. [DOI] [PMC free article] [PubMed] [Google Scholar]
- 2. Liang G, Bansal G, Xie Z and Druey KM (2009) RGS16 inhibits breast cancer cell growth by mitigating phosphatidylinositol 3‐kinase signaling. J Biol Chem 284, 21719–21727. [DOI] [PMC free article] [PubMed] [Google Scholar]
- 3. Wiechec E, Overgaard J and Hansen LL (2008) A fragile site within the HPC1 region at 1q25.3 affecting RGS16, RGSL1, and RGSL2 in human breast carcinomas. Genes Chromosom Cancer 47, 766–780. [DOI] [PubMed] [Google Scholar]
- 4. Kim JH, Lee JY, Lee KT, Lee JK, Lee KH, Jang KT, Heo JS, Choi SH and Rhee JC (2010) RGS16 and FosB underexpressed in pancreatic cancer with lymph node metastasis promote tumor progression. Tumour Biol 31, 541–548. [DOI] [PubMed] [Google Scholar]
- 5. Thiery JP, Acloque H, Huang RY and Nieto MA (2009) Epithelial‐mesenchymal transitions in development and disease. Cell 139, 871–890. [DOI] [PubMed] [Google Scholar]
- 6. Neve RM, Chin K, Fridlyand J, Yeh J, Baehner FL, Fevr T, Clark L, Bayani N, Coppe JP, Tong F et al (2006) A collection of breast cancer cell lines for the study of functionally distinct cancer subtypes. Cancer Cell 10, 515–527. [DOI] [PMC free article] [PubMed] [Google Scholar]
- 7. Charafe‐Jauffret E, Ginestier C, Monville F, Finetti P, Adelaide J, Cervera N, Fekairi S, Xerri L, Jacquemier J, Birnbaum D et al (2006) Gene expression profiling of breast cell lines identifies potential new basal markers. Oncogene 25, 2273–2284. [DOI] [PubMed] [Google Scholar]
- 8. Horiguchi K, Sakamoto K, Koinuma D, Semba K, Inoue A, Inoue S, Fujii H, Yamaguchi A, Miyazawa K, Miyazono K et al (2012) TGF‐β drives epithelial‐mesenchymal transition through δEF1‐mediated downregulation of ESRP. Oncogene 31, 3190–3201. [DOI] [PMC free article] [PubMed] [Google Scholar]
- 9. Fukagawa A, Ishii H, Miyazawa K and Saitoh M (2015) δEF1 associates with DNMT1 and maintains DNA methylation of the E‐cadherin promoter in breast cancer cells. Cancer Med 4, 125–135. [DOI] [PMC free article] [PubMed] [Google Scholar]
- 10. Shirakihara T, Horiguchi T, Miyazawa M, Ehata S, Shibata T, Morita I, Miyazono K and Saitoh M (2011) TGF‐β regulates isoform switching of FGF receptors and epithelial‐mesenchymal transition. EMBO J 30, 783–795. [DOI] [PMC free article] [PubMed] [Google Scholar]
- 11. Shirakihara T, Saitoh M and Miyazono K (2007) Differential regulation of epithelial and mesenchymal markers by δEF1 proteins in epithelial mesenchymal transition induced by TGF‐β. Mol Biol Cell 18, 3533–3544. [DOI] [PMC free article] [PubMed] [Google Scholar]
- 12. Miyoshi N, Ishii H, Sekimoto M, Doki Y and Mori M (2009) RGS16 is a marker for prognosis in colorectal cancer. Ann Surg Oncol 16, 3507–3514. [DOI] [PubMed] [Google Scholar]
- 13. Saitoh M (2015) Epithelial‐mesenchymal transition is regulated at post‐transcriptional levels by transforming growth factor‐β signaling during tumor progression. Cancer Sci 106, 481–488. [DOI] [PMC free article] [PubMed] [Google Scholar]
- 14. Shirakihara T, Kawasaki T, Fukagawa A, Semba K, Sakai R, Miyazono K, Miyazawa K and Saitoh M (2013) Identification of integrin α3 as a molecular marker of cells undergoing epithelial‐mesenchymal transition and of cancer cells with aggressive phenotypes. Cancer Sci 104, 1189–1197. [DOI] [PMC free article] [PubMed] [Google Scholar]
- 15. Furlan A, Vercamer C, Bouali F, Damour I, Chotteau‐Lelievre A, Wernert N, Desbiens X and Pourtier A (2014) Ets‐1 controls breast cancer cell balance between invasion and growth. Int J Cancer 135, 2317–2328. [DOI] [PubMed] [Google Scholar]
- 16. Paumelle R, Tulasne D, Kherrouche Z, Plaza S, Leroy C, Reveneau S, Vandenbunder B and Fafeur V (2002) Hepatocyte growth factor/scatter factor activates the ETS1 transcription factor by a RAS‐RAF‐MEK‐ERK signaling pathway. Oncogene 21, 2309–2319. [DOI] [PubMed] [Google Scholar]
Associated Data
This section collects any data citations, data availability statements, or supplementary materials included in this article.
Supplementary Materials
Fig. S1. (A) Overexpression of RGS16 slightly affects expression of EMT markers. MDA‐MB231 and BT549 cells were infected with lentiviruses encoding negative control or RGS16, followed by qRT‐PCR. Each value represents the mean ± SD of triplicate determinations from a representative experiment. Similar results were obtained at least three independent experiments. (B) Levels of GTP‐Rho in RGS16‐overexpressd cells. As with Fig. 2E, after Rho activation assays in three independent experiments (1st, 2nd and 3rd), the ratio of GTP‐Rho to total Rho was validated by densitometric analyses and shown at the bottom.