
Figure 4.
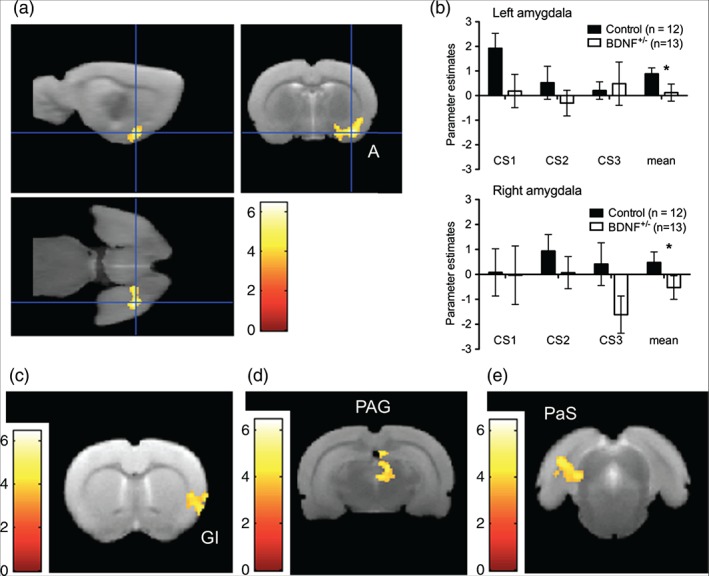
SPMs showing brain activation (BOLD signal) in response to the CS versus baseline that was greater in control rats (n = 12) than in BDNF+/− rats (n = 13). (a) Coronal, sagittal and axial views of the cluster over the left amygdala [A; P FWE < 0.001, KE = 490, peak T = 6.49 at (46, −12, −20)]. (b) Parameter estimates from left and right amygdala across the three CS presentations; *main effect of genotype P < 0.05. (c) The GI [P FWE < 0.06, KE = 195, peak T = 5.38 at (58, 12, −2)], (c) the PAG [P FWE = 0.062, KE = 193, peak T = 4.79 at (6, −52, 38)] and e) the right parasubiculum [PaS; P FWE = 0.057, KE = 198, peak T = 4.91 at (−48, −76, 30)]. SPMs are presented overlaid on the average structural image (n = 25) and the right side of the image is the left side of the brain. Scale bar represents T‐score.