
Figure 1.
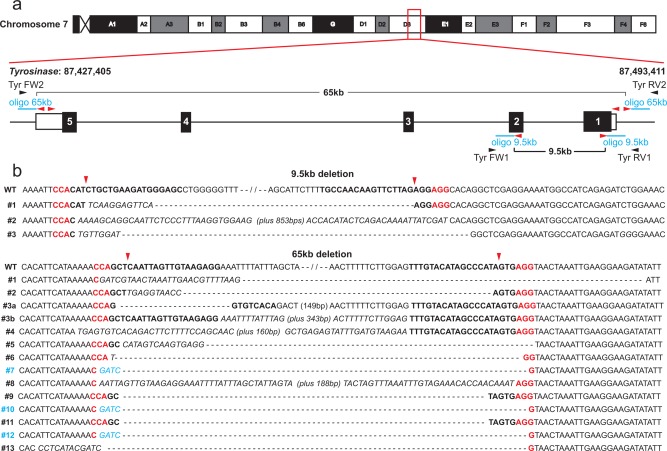
Generation of small deletions using CRISPR/Cas9. (a) Schematic representation of the CRISPR/Cas9 gRNA sites (red arrowheads) for the 9.5 and 65 kb deletions as well as genotyping primer sites (black arrowheads) and oligonucleotides (blue). (b) Deletion junction sequences for the 3 founders for the 9.5 kb deletion and the 13 founders for the 65 kb deletion with gRNA sites indicated in bold and PAM sites in red. The expected gRNA cut site is indicated by red arrowheads. Sequences marked in blue show deletions with defined breakpoints directed by the oligonucleotide.