
Fig. 6.
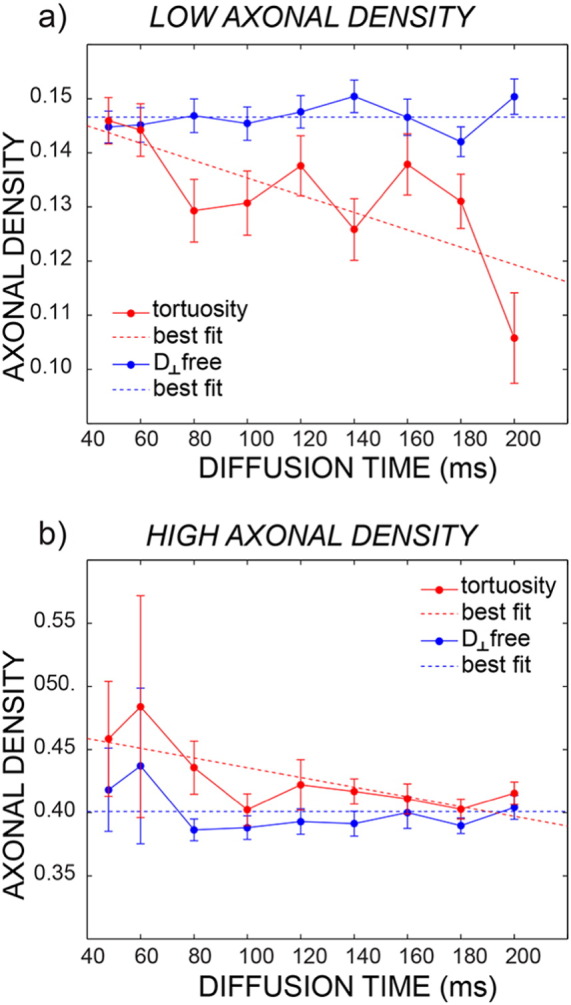
Mean axonal density and standard error at varying diffusion times for the same subject of Fig. 5. The plots are reported separately for low axonal density (a) and high axonal density (b). The blue fit is obtained without using the tortuosity model, while the red fit is obtained using the tortuosity model. Dashed lines represent the best fit of axonal density estimates over all diffusion times according to the Bayesian information criterion (see text for details).