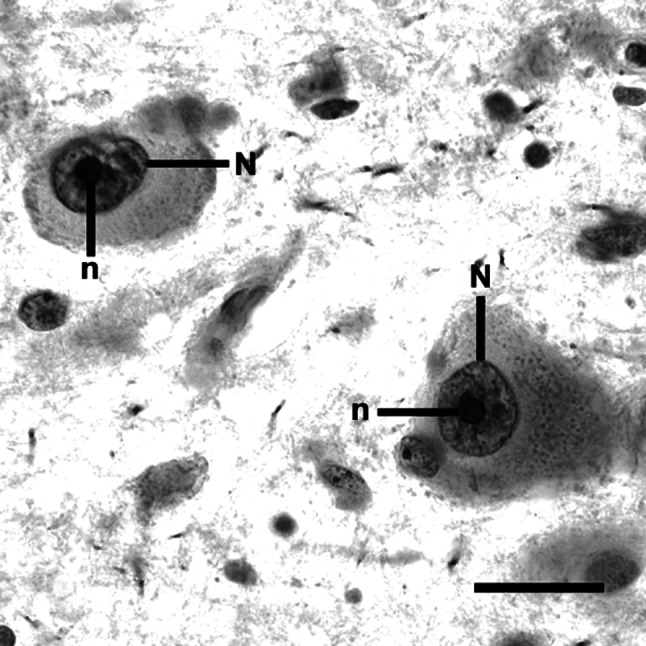
Fig. 1.

After AgNOR staining, the borders of AgNOR areas (representing nucleoli) (n) are clearly visible within nuclei (N) of DRN neurons (control case, interfascicular subnucleus, scale bar 20 µm). The differences in AgNOR parameters were beyond qualitative evaluation, and they could only be captured by means of quantitative measurements
