Fig. 1.
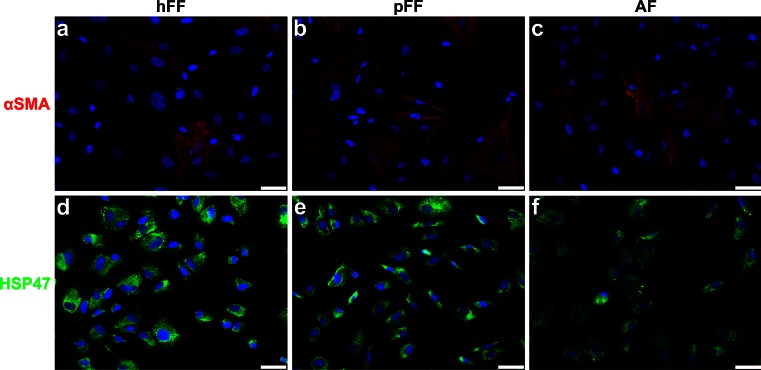
Cell characterization by αSMA and HSP47 expression in hFF, pFF and AF (porcine), cells cultured on glass for 2–3 days and stained for DAPI (blue), HSP47 (green) and αSMA (red). a–c All cell sources showed a number of αSMA positive cells in the cell population. All αSMA positive cells showed stress fiber formation. d–f HSP47 stained the cytoplasm of all cells, indicating their fibroblastic phenotype. Scale bars 50 μm

