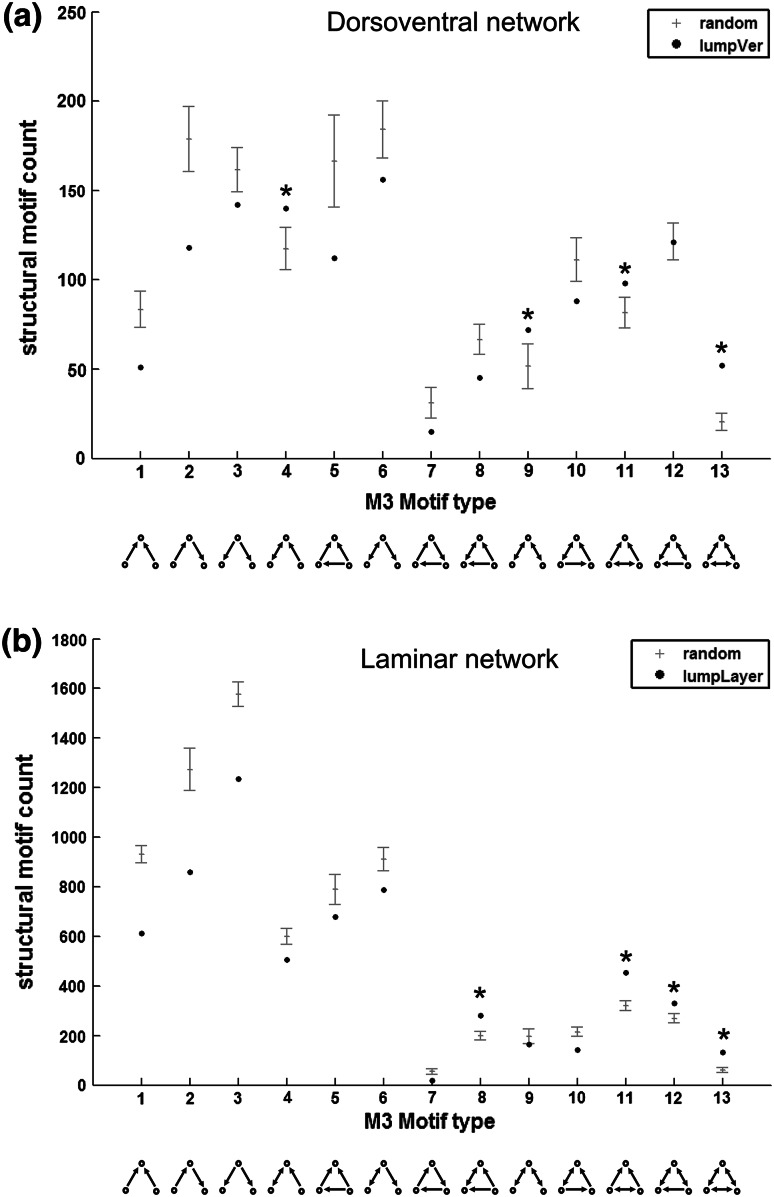
Fig. 3.
Structural motif analysis of the dorsoventral (a) and laminar network (b). The frequency of the M = 3 directed motifs is indicated with a black circle and the motif counts of the random null models are represented by the mean ± standard deviation (grey lines). Asterisk indicate motifs with significantly increased occurrence over random networks

