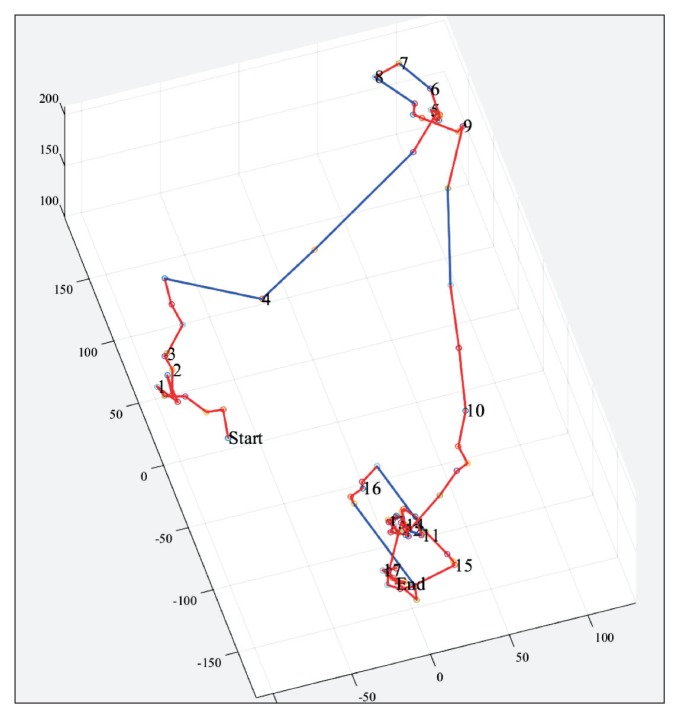
Figure 2.
Example of 3-dimensional trajectory of colonic passage of a single capsule illustrated in the custom designed interactive graphical user interface. “Start” marks the ileocecal passage and “End” marks the expulsion of the capsule. A red line represents a progression of less than 50 mm the last 10 minutes. A blue line represents a progression of more than 50 mm during the last 10 minutes. Hepatic flexure, splenic flexure, and descending end can be marked in the trajectory in order to calculate segmental colonic transits.

