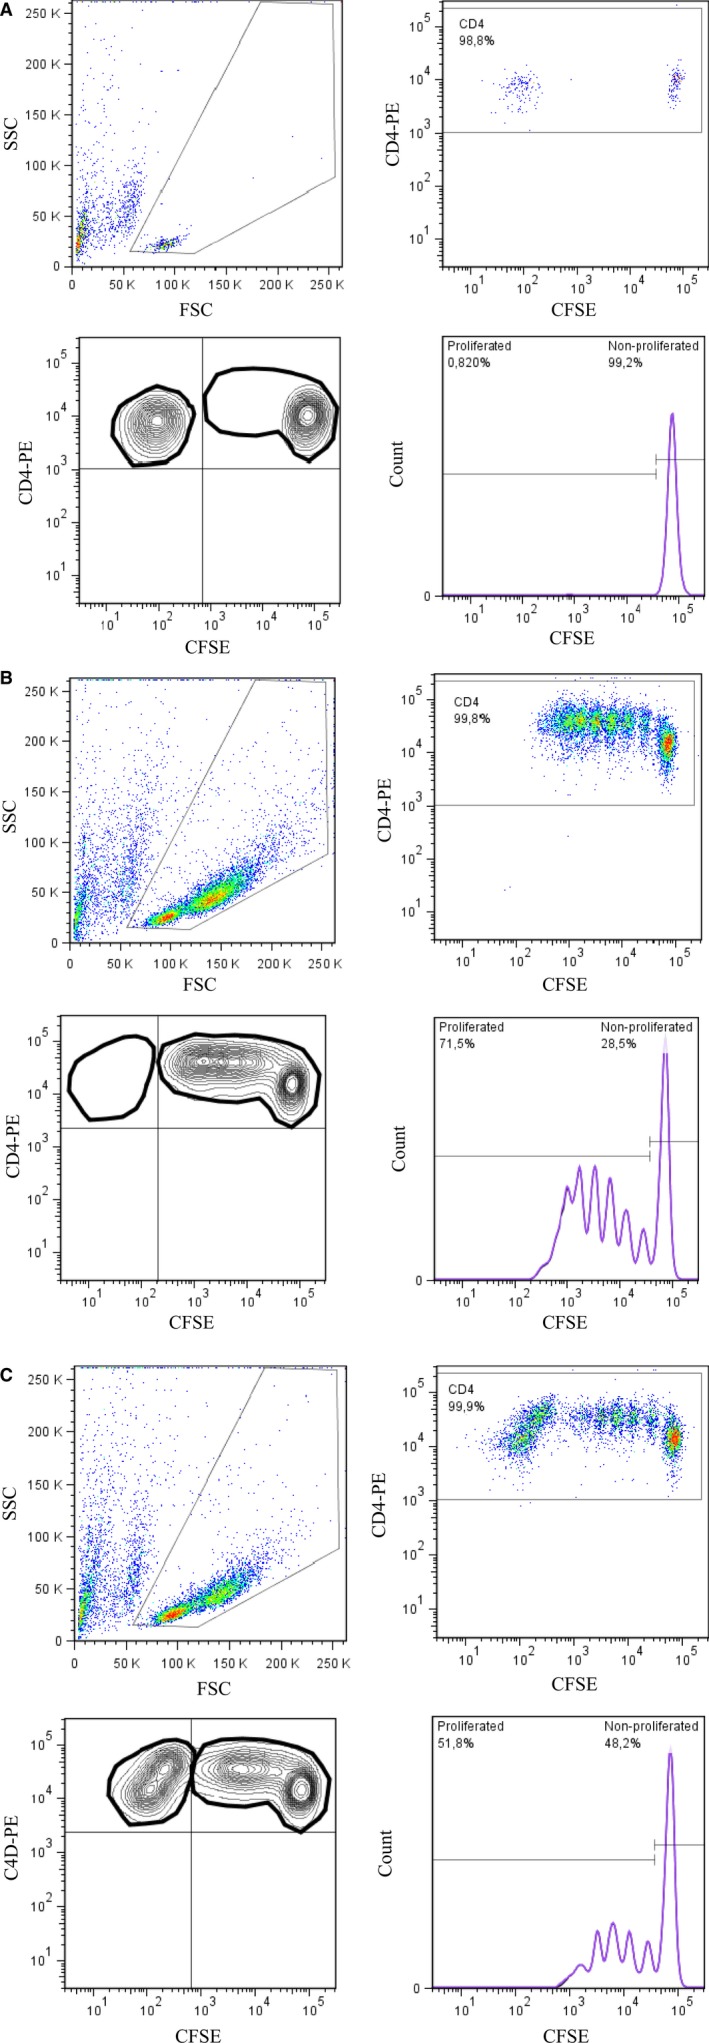
Figure 2.

Representative plots and the gating information from the Treg suppression assay. After 6 days' stimulation with anti‐CD3/CD28 beads, viable lymphocytes were first gated (upper left). The second gate was created for the CD4+ cells (upper right). The third gate (lower left) represents proliferated Teff cells and the proliferation % was expressed by the histogram (lower right). The suppression % was calculated from stimulated Teff cells with or without Tregs, as, for example, 100−(51.8/71.5) × 100% = 27.6% (Fig. 2B and 2C). A: Representative figure from a cell co‐culture (Teff + Treg) with no stimulating agent. B: Single culture where Teff cells were stimulated with anti‐CD3/CD28 beads without suppressing Treg cells. C: In co‐culture, Treg and Teff cells were cultured and stimulated with anti‐CD3/CD28 beads in the same well.
