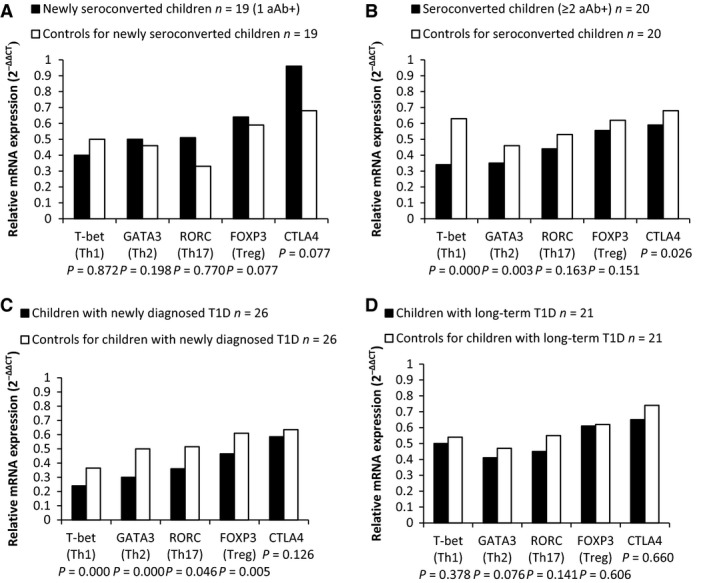
Figure 5.

Relative mRNA expression levels, measured from total peripheral blood RNA, of different T cell subset markers in the various stages of type 1 diabetes. The relative mRNA expression analysis for T cell markers (Th1 = T‐bet, Th2 = GATA3, Th17 = RORC, Treg = FOXP3 and CTLA‐4) was performed with real‐time qPCR assay and quantitated as a fold change against the common control by using the 2−∆∆ CT method. A: recently seroconverted children, B: children positive for multiple autoantibodies, C: children with newly diagnosed T1D, D: children with long‐lasting T1D. Case groups are represented by black bars, and age‐ and sex‐matched control children for each group are shown in white bars.
