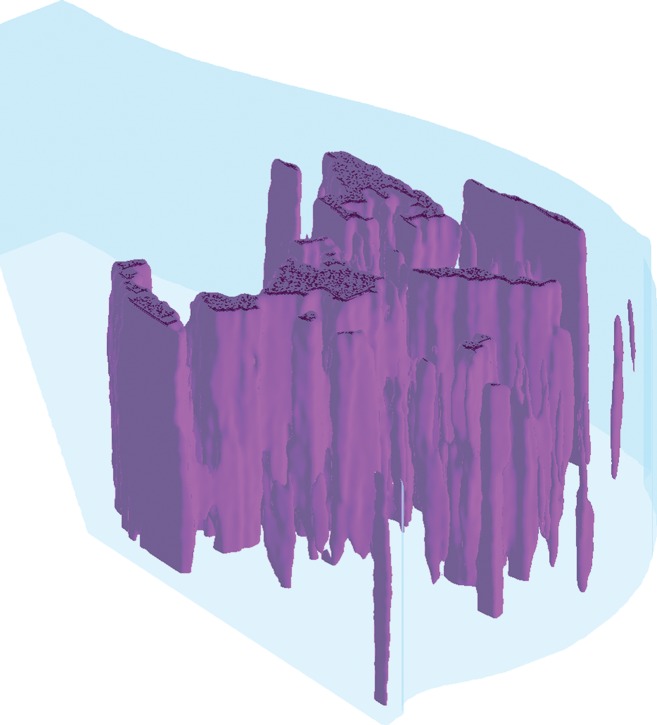
Figure 1d:
Algorithm outline for VBD estimation from DBT images. The process is performed in four steps: (a) Dense versus nondense tissue segmentation is conducted on tomosynthesis source projection images (the green boundaries represent the dense tissue). (b) A tridimensional likelihood map is constructed from the projection images (an intermediate section is shown). The brightness indicates the probability of being dense tissue. (c) Features are extracted from each tomosynthesis reconstructed section (color shows intensity), and (d) the 3D fibroglandular tissue is segmented on the basis of multifeature support vector machine classification.

