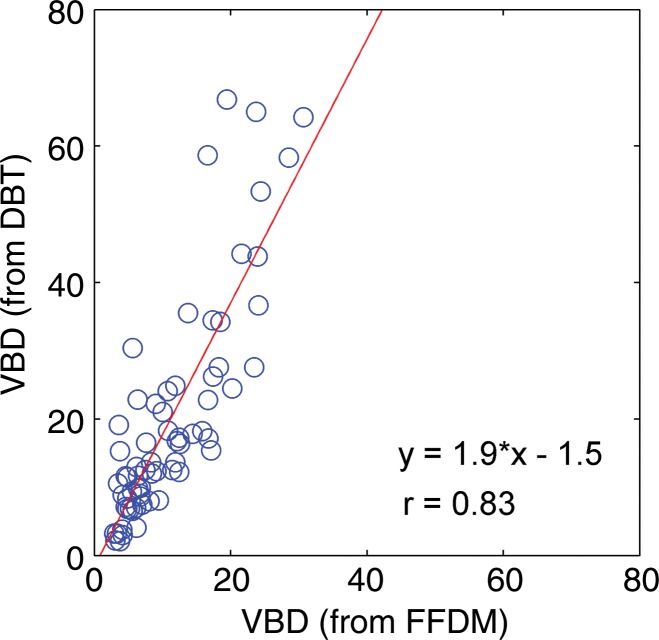
Figure 5b:
Scatterplots show strong associations between the VBD estimates obtained from FFDM, MR imaging, and DBT images. (a) FFDM versus MR imaging, (b) FFDM versus DBT, (c) and MR imaging versus DBT results are shown. Linear regression lines, along with the related r values, are also demonstrated.

