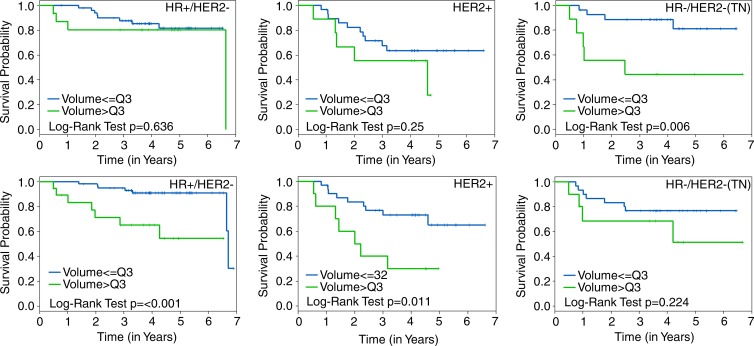
Figure 4:
Graphs show Kaplan-Meier plots with RFS estimates by time point and HR and HER2 subtype. RFS stratified by FTV2 (top row) is compared with FTV4 (bottom row) by using the highest quartile (Q3) cut point for HR-positive (HR+) and HER2-negative (HER2-), HER2-positive (HER2+), and HR-negative/HER2-negative (HR-/HER2-; triple negative) subtypes, respectively, left to right. The log-rank test P value is shown for each plot.

