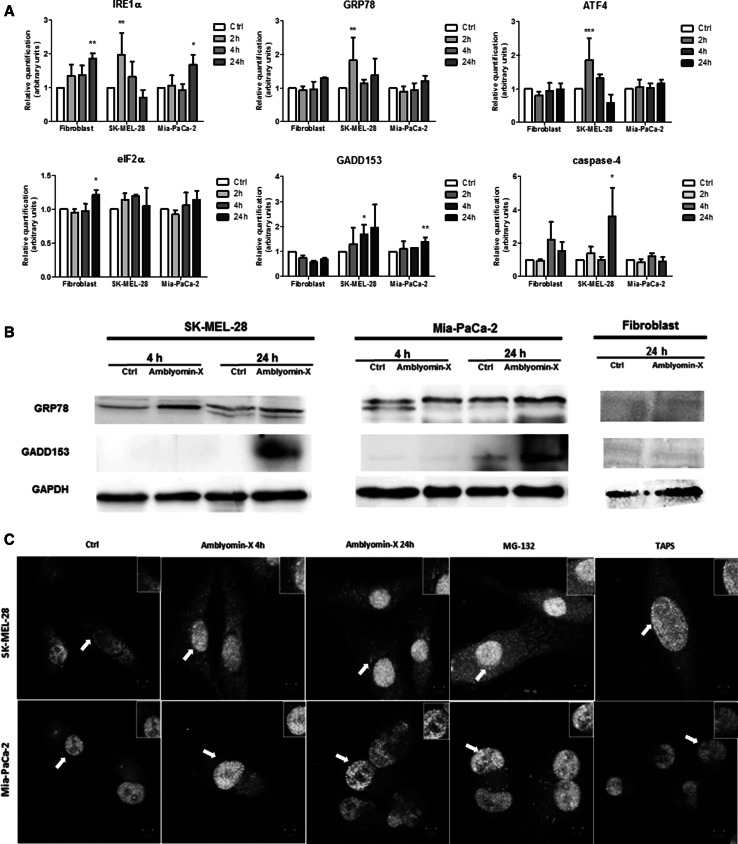
Fig. 1.
Amblyomin-X induces ER stress in tumor cells. a Cells were treated with Amblyomin-X (0.5 µM) at the indicated times and levels of gene expression of targets related to ER stress were evaluated by real-time PCR. b After the indicated period of treatment, cells were lysed with RIPA buffer and 30 µg of total protein was used for the tests. Western blot analysis was performed by checking anti-GRP78, anti-GADD153, and anti-GAPDH (endogenous controls). c Confocal microscopy analysis of indirect immunofluorescence of ATF-6α and ERGIC53. Cells treated with vehicle (PBS), or with 0.5 µM of Amblyomin-X for 4 or 24 h, or with MG-132 (2.5 µM) and TAPS (1 µM) for 24 h each. The final overlay image is a representative of three independent experiments in which red fluorescence represents ATF-6α, while green fluorescence represents ERGIC53, and yellow corresponds to merging of both red and green. Values are mean ± SD of three independent experiments. *p ≤ 0.05; **p ≤ 0.01, and ***p ≤ 0001. (Color figure online)

