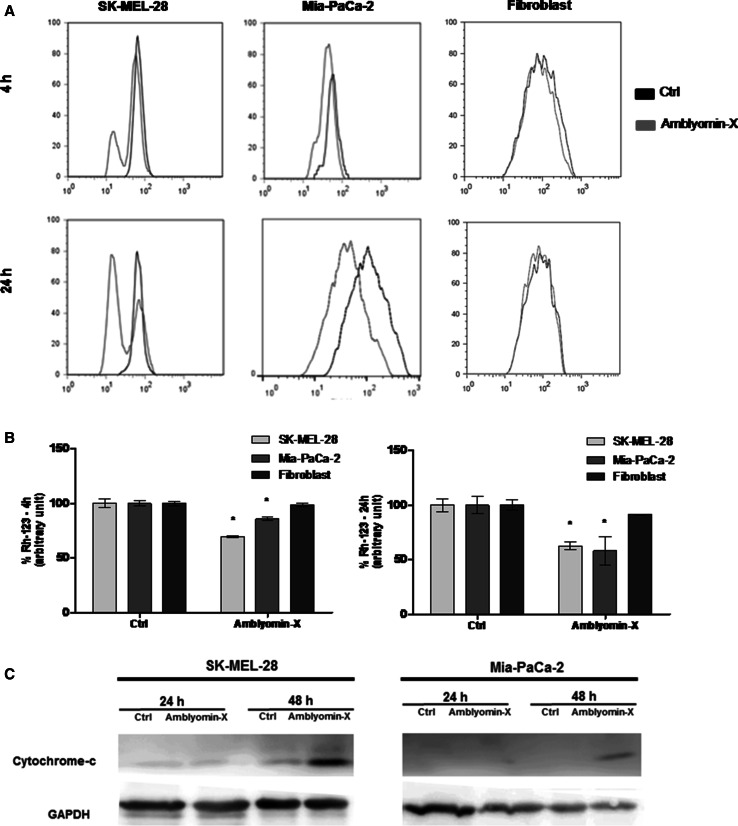
Fig. 3.
Mitochondrial dysfunction induced by Amblyomin-X in tumor cells. a Histogram representing the mitochondrial membrane potential. Cells were treated with Amblyomin-X (0.5 µM) for 4 h and 24 h. b Bars graph (fluorescence intensity) values ± SD obtained from a (three independent experiments). c After the indicated periods of treatments, cells were lysed. The cytoplasm and membrane were separated and 30 µg of cytoplasmic protein fractions was separated on SDS-PAGE. The Western blot of the samples was performed using anti-cytochrome-c and anti-GAPDH (endogenous control)

