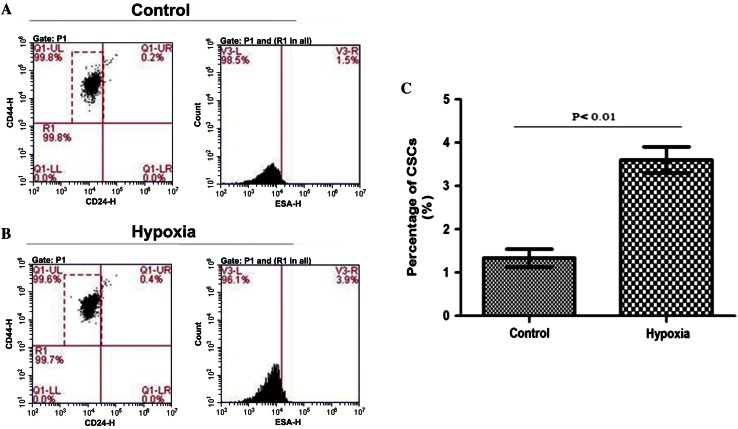
Fig. 4.
Effect of hypoxia on expression of stem cell markers in MDA-MB-231 cells. a Normoxic control group; b hypoxic group; and c group comparison of percentage of cells expressing CD24−CD44+ESA+: it is significantly higher in the hypoxic group 3.60 ± 0.30 % compared with the normoxic group 1.33 ± 0.21 % (P < 0.01)

