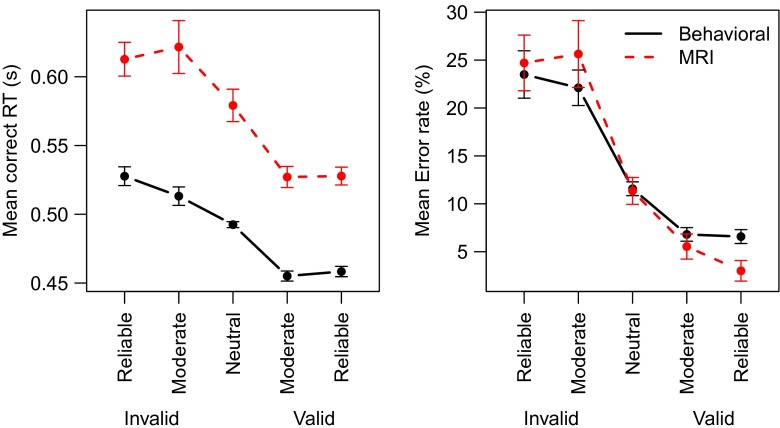
Fig. 2.
Mean behavior in Experiment 3 displays effects of cue validity and session. Dashed red line MRI session; Solid black line Behavioral session. Error bars represent within-subject standard errors of the mean (Loftus & Masson, 1994). In this and subsequent figures the data pertaining to the MRI sessions are indicated in red

