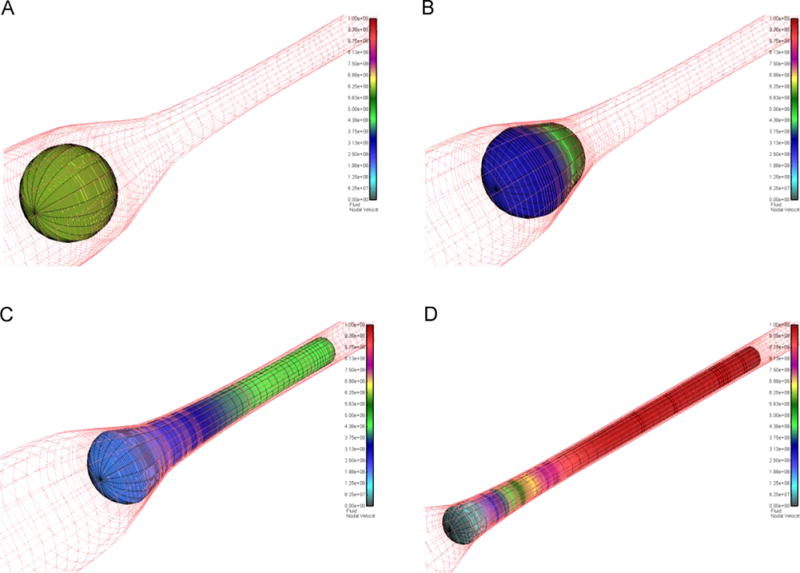
Fig. 2.

Passage of an 18 μm CTC into the 7 μm capillary. (A) The CTC in the initial, undeformed state. Black lines indicate the FE mesh of the solid, red lines represent the wall geometry. Colors: CTC velocity. (B) CTC begins to enter the capillary. (C) About half of the CTC is inside the capillary. (D) The CTC is just about to be completely inside the capillary. Scalebars are the same for all panels. Fluid omitted for clarity; CTC stiffness 100 Pa. Same view for (A)–(C), zoomed out for (D). (For interpretation of the references to color in this figure legend, the reader is referred to the web version of this article.)
