
Fig. 7.
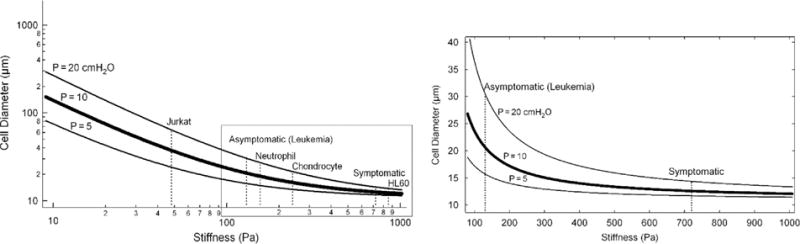
Pressure curves based on the pressure–diameter–stiffness relationship. Left: Log–log plot of CTC diameter as a function of CTC stiffness for three pressure curves: Pphysiologic=10 cmH2O (thick solid line), P=20 cmH2O, and P=5 cmH2O. Vertical dashed lines indicate experimentally measured stiffness values for various cell types (see Results for details) [16,18,35–37]. The intersection of the dashed lines with the 3 solid pressure curves indicate the maximal cell size that can pass for the given pressure curve (e.g. for P=10 cmH2O the maximum size of Neutrophil that will pass through is 20 μm). Asymptomatic and symptomatic: cell stiffness measured from clinical blood samples of pediatric acute lymphoblastic leukemia (ALL) patients [16,35]. Right inset: Boxed region on left is re-plotted on a linear scale to better demonstrate the hyperbolic character of the pressure curves. For clarity only the leukemia stiffness values are shown on the linear plot.