
Fig. 3.
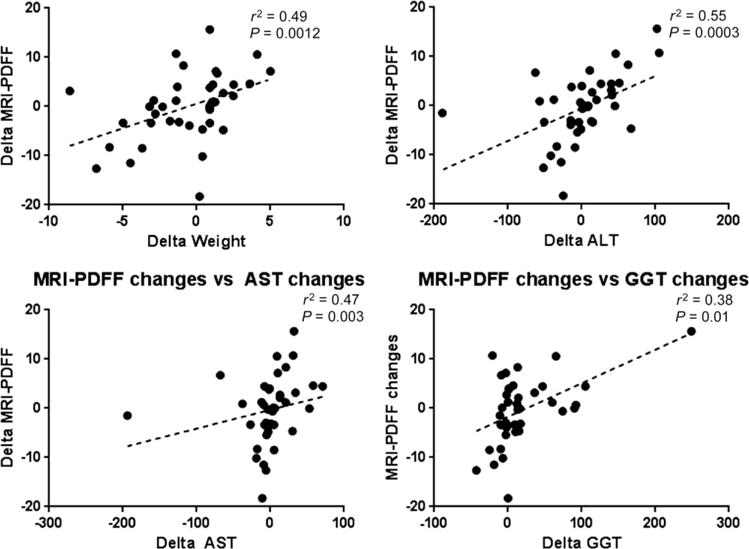
MRI-PDFF changes between weeks 0 and 24 and their association with clinical and laboratory changes in patients with biopsy-proven NAFLD. MRI-PDFF changes correlated with changes in weight (r2 = 0.49, P = 0.0012), ALT (r2 = 0.55, P = 0.0003), AST (r2 = 0.47, P = 0.003), and GGT (r2 = 0.38, P = 0.01).