
Figure 2. Multiple cytokine production in stimulated T cells in the presence of lovastatin.
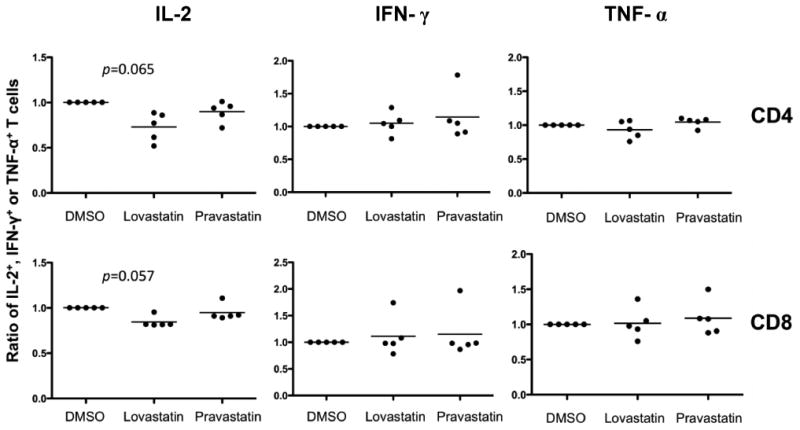
Scatter plots with data from 5 donors for ratio of frequency of IL-2+, IFN-γ+, TNF-α+ in lovastatin- or pravastatin-treated T cells to DMSO control. PBMCs were stimulated with OKT3 in the presence of 10 μM lovastatin, 10 μM pravastatin or the vehicle control DMSO. FACS analyses were performed using mAbs for CD4, CD8, IL-2, TNF-α and IFN-γ. At least 3×10⁵ total events were analyzed and cytokine-positive populations were defined based on the upper limits of fluorescence of unstimulated cells stained with the same antibodies. Median frequency of IL-2+, IFN-γ+, TNF-α+ in stimulated T cells without statin treatment, were 2.9%, 21.1%, 21.1% in CD4+ T cells, and 1.0%, 12.7%, 12.9% in CD8+ T cells. The y axis represents the ratio of IL-2+, IFN-γ+ or TNF-α+ T cells in statin-treated samples normalized to the DMSO control. Statistical analyses were performed using Prism software (GraphPad, San Diego, CA). Intergroup comparisons were performed using Wilcoxon matched pair analysis. All p values were two-tailed and considered significant if less than 0.05 (IL-2 in CD4+ T cells: p=0.065, IL-2 in CD8+ T cells: p=0.057, IFN-γ, TNF-α: p>0.1).