
Figure 2.
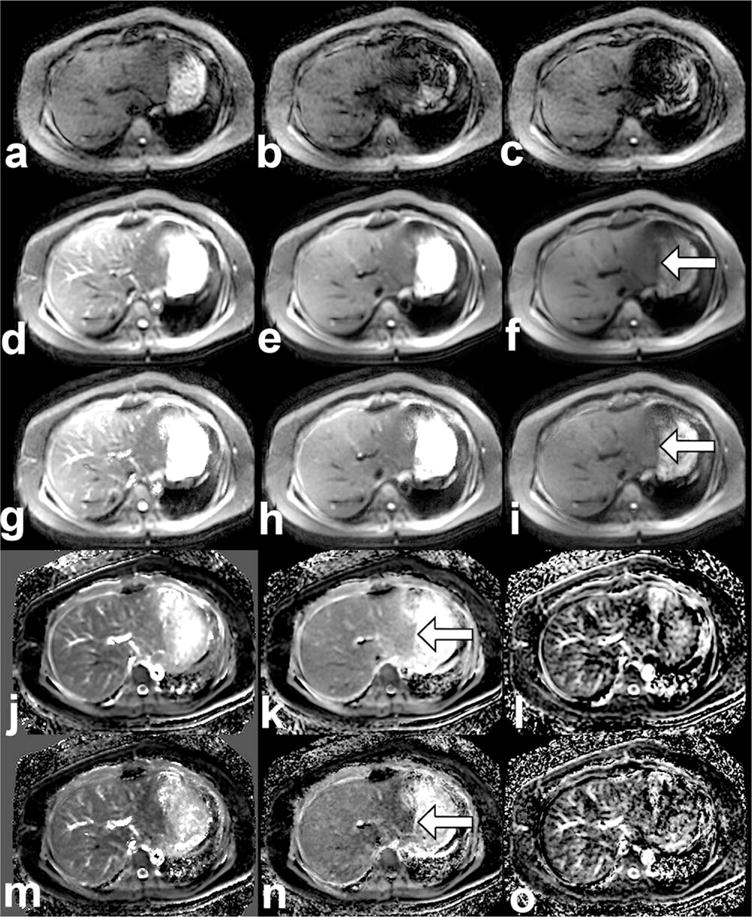
DWI source images, reconstructions, and parameter maps. Single-excitation b = 500 source images are shown (a–c) prior to reconstruction, with varying signal intensity due to bulk motion. Multiexcitation images are shown at b-values (0, 100, 500) for the CMA reconstruction method (d–f) and for the BLN reconstruction method (g–i). Parametric maps are shown for ADC, D, and F from the CMA method (j–l) and from the BLN method (m–o). All images are from a patient with NASH (histologic scores: steatosis 2, inflammation 2, ballooning 2, definite NASH, fibrosis 1a). The scale of each image is as follows: source images and reconstructions (0–300 arbitrary units), ADC (0–5 10−3 mm2/s), D (0–3 10−3 mm2/s) and F (0–50%). Arrows indicate regions in which differences between CMA and BLN reconstructions (f,I) and D maps from each reconstruction (k,n) are the most conspicuous.