
Figure 3.
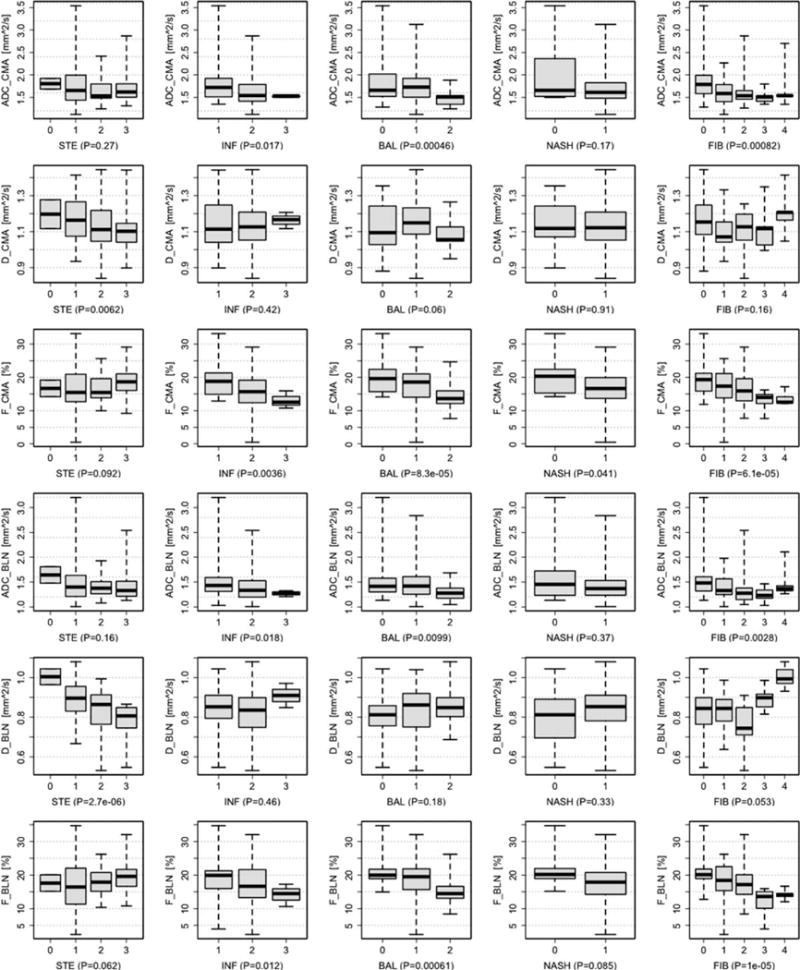
Trend tests. Trends in DWI parameters (ADC top, D middle, F bottom) for each histologic feature (STE: steatosis, INF: inflammation, BAL: ballooning, NASH, and FIB: fibrosis) are shown above. The barplot indicates the minimum, 1st, 2nd, 3rd quartiles, and maximum value of each DWI parameter for each observed score of histologic feature. Plots for ordinal variables are annotated with the P-value of the Jonckheere-Terpstra test for trends. Plot for the categorical variable NASH is annotated with the P-value from the Wilcoxon signed rank test. Parameters derived from the CMA (top) and BLN (bottom) reconstruction methods are shown.