
Fig. 5.
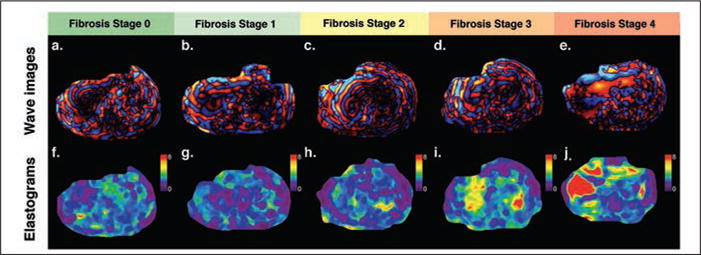
MR elastography in different subjects correlated with biopsy-documented fibrosis stages.
A–J, Axial wave cine loops (A–E) and corresponding axial elastogram images (F–J) are shown for subjects with fibrosis stages 0–4. Color elastogram represents magnitude of complex shear modulus with scale from 0 to 8 kPa.