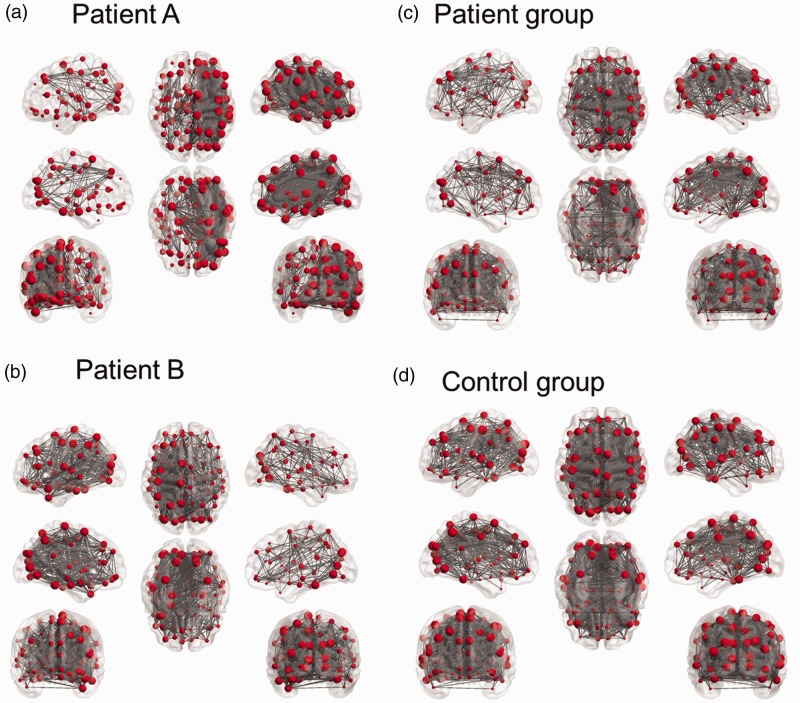
Figure 1.
(a and b) The connectivity maps of two patients. Patient A had left internal carotid artery (ICA) 90% stenosis (b), and patient B had right ICA 71% stenosis (b). (Patient A: r threshold = 0.60, density = 0.20; Patient B: r threshold = 0.41, density = 0.20); (c and d): the averaged connectivity maps of patients (c) and controls (d). The connectivity matrices of the patients with right-side stenosis were left-right flipped before averaging with those with left-side stenosis. (Patients: r-threshold = 0.36, density = 0.20; Healthy controls: r-threshold = 0.36, density = 0.31).

